Hey there, and welcome back to the fifth episode of this series where we talk about, learn, and explore Network Tools and Troubleshooting! This time, we will be diving into application layer or layer 7 tools and troubleshooting techniques, and as always, I hope you enjoy and let me know your thoughts!
You may find the previous parts below:
- First part – Troubleshooting connectivity (Layer 4 TCP/IP)
- Second part – Troubleshooting latency, performance, and throughput
- Third part – Troubleshooting DNS
- Fourth part – Packet Analysis (Wireshark, TCPDump, Netsh, etc.)
In this fifth episode, we will be talking about:
The application layer, sometimes known as layer 7, “or not-my-problem, go and ask the developers” layer for many network engineers(? Anyway, that one! Even though there are good possibilities you may not need to know a lot about the application layer when working in a pure routing and switching network position, investing some time into it and learning about the tools used for troubleshooting, will greatly benefit you to be a more complete network engineer and IT specialist in general.
Without further addition, let’s get right into it! To get started, let’s review the OSI model for a second, looking at the picture below:
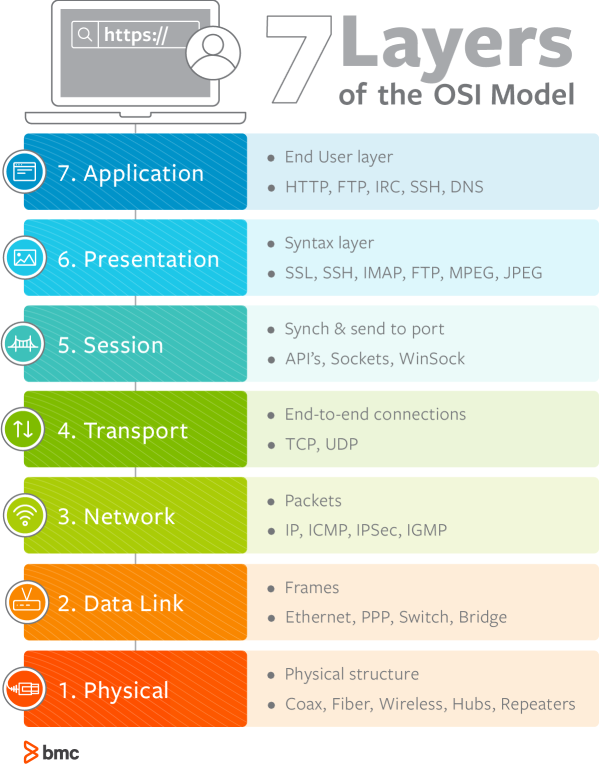
In the above image, we can see the application layer as our last layer of the model, arguably speaking, this is the most seen layer by users, with HTTP (HyperText Transfer Protocol) being the most widely used protocol on the web. HTTP is the protocol used by web browsers/clients to navigate the internet and request responses from web servers (think opening your favorite browser and googling cats.com), HTTP works on top of TCP and uses a request-response approach for its functioning (check our previous post for a breakdown of an HTTP request in Wireshark).
I also like this image from startertutorials.com:
There are many situations in which you may be working as a network engineer and will need to collaborate with internal teams to troubleshoot and identify what ends up being an application layer issue, Wireshark could be useful in these situations BUT most of the time, chances are you will be working with a TLS-encrypted application (HTTPS, SFTP, etc.), in which after the TCP/TLS handshakes are established you will only see “Application data” in Wireshark:
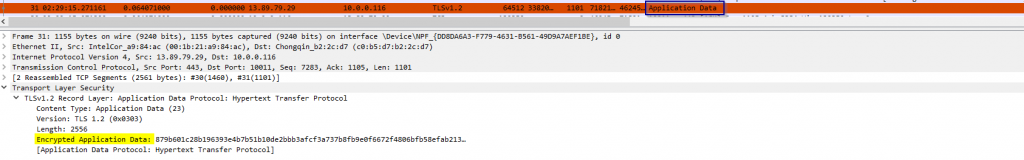
That application data are encrypted packets to which we won’t be able to see the details in Wireshark unless we decrypt them using the session keys for that conversation. Capturing the session keys can be a bit tricky, instead, let’s explore some of the tools we could use for native layer 7 troubleshooting:
CURL: Or simply client URL (cURL), is a wonderful command line tool we can use natively in most Windows and Linux/Unix-based systems. In the words of its creator “Curl is used in command lines or scripts to transfer data” (Daniel Stenberg, 1998). I find its description in the man pages very useful too:
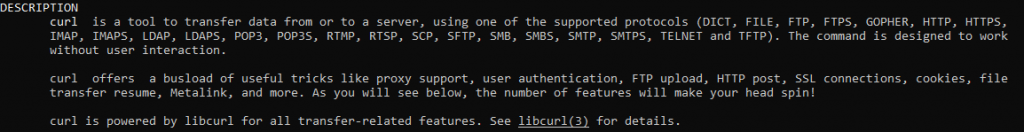
What does this mean for us? Well, there are too many things you can do with Curl, but in this post, we will be focusing on some of its options and on how to use them to simulate HTTP and HTTPS requests for troubleshooting and differentiating application and network-layer issues using our favorite command-line/terminal.
First, open a terminal window, I will be using WSL running Ubuntu on Windows. Then, let’s explore the fundamental options:
curl -h # Always a good practice to familiarize yourself with the help command and explore the options/flags available for any command (also check man curl).

curl -v <URL> # For verbose, allows to get more details from each request, you can add multiple v's for more details, ex: curl -vvv http://cats.com

curl -i <URL> # Include the HTTP response headers in the output.The HTTP response headers can include things like server name, cookies, date of the document, HTTP version and more. Ex: curl -vvv -i http://cats.com

curl -H <custom_header> <URL> # Allows to pass a custom header to a server when sending a request, in this example it could be used to send an HTTP 2 request to a web server, ex: curl -i -H "Connection: upgrade" -H "Upgrade: h2c" https://test.mfk-labs.com
Again, I definitely recommend you check out the curl -h and the man curl commands to familiarize yourself with the available options. Now, how can we use Curl for the Application layer and in general network troubleshooting? One situation could be when you find an application-level issue, curl can help with diagnostics, let’s say someone messages you and says “Our website is not working!! This must be a network issue since nothing has changed with the web server.. attached is an image”
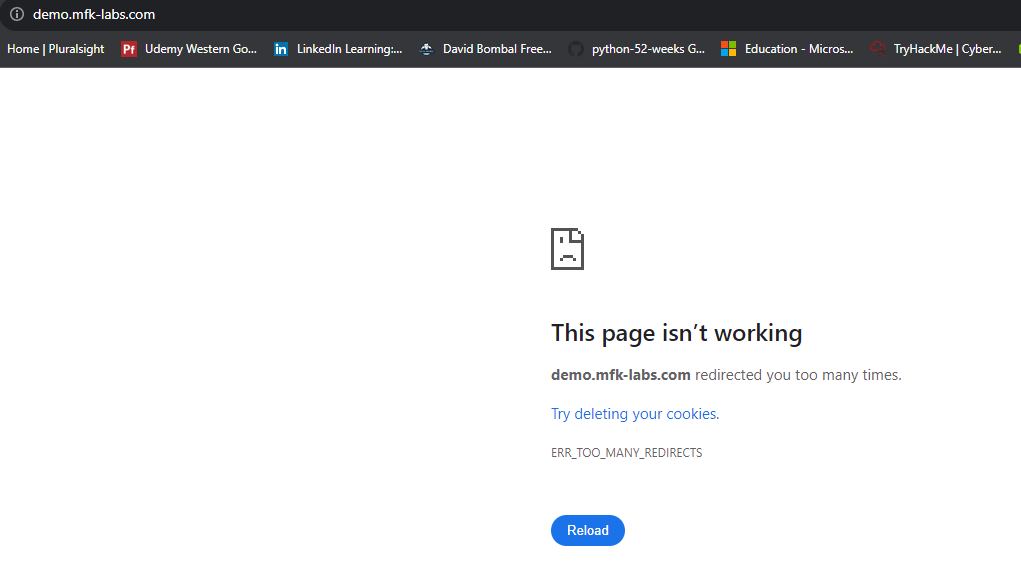
Umm, first instincts say this may not be a network issue, but how can we confirm it? Well, let’s first define what is a network issue, I think a network issue would be a layer 3 or 4 connectivity issue, in which we are not able to establish a TCP handshake with the destination, we’ve previously discussed ways to confirm that, but let’s use curl and see what can we find:
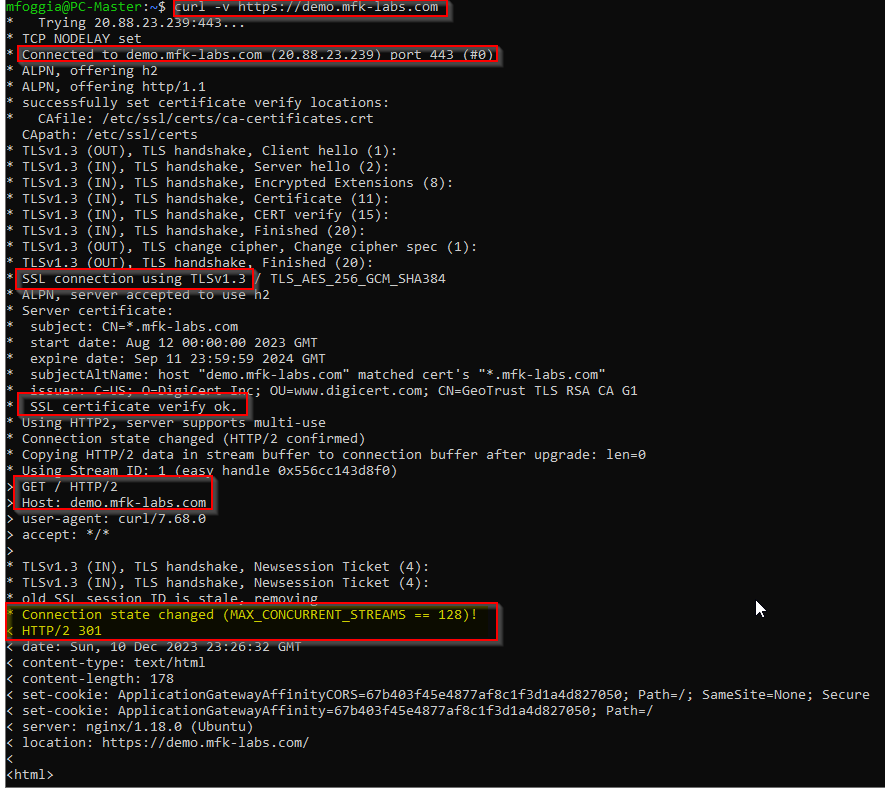
So the first line in red is our curl command running from my WSL terminal (one thing to note is curl can be used both in Windows and Linux), in the next red line we can see “Connected to demo.mfk-labs.com (20.88.23.239) port 443 (#0)”, this essentially tells us that we can resolve the FQDN to an IP and connect to our website successfully in TCP port 443 (HTTPS), the next 2 lines confirm that we’re able to successfully negotiate and complete the TLS/SSL handshake and that we are ready to receive the content from our website, hence our PC/client will send an HTTP “GET /” request to our host: demo.mfk-labs.com.
Awesome! So this confirms we have connectivity from layers 1 to 6, what’s left? Oh yes, application, what happens after our GET request? We can see the following messages:

That’s interesting, we are getting another redirect (HTTP 301) from the web server, which is redirecting us back again to https://demo.mfk-labs.com, as we can see in the location.

That will be a problem! And it will also explain why the web browser shows the error of “Too many redirects”. Alright, now we know the web server or proxy that is receiving our requests is the one causing the “Too many redirects” issue, let’s say we go to our dev application’s team and let them know this is the issue, they tell us, “it must be the application gateway, all requests are first received by it before reaching our website” Ha, that may be possible, maybe our application gateway logs can give us a bit more of information:
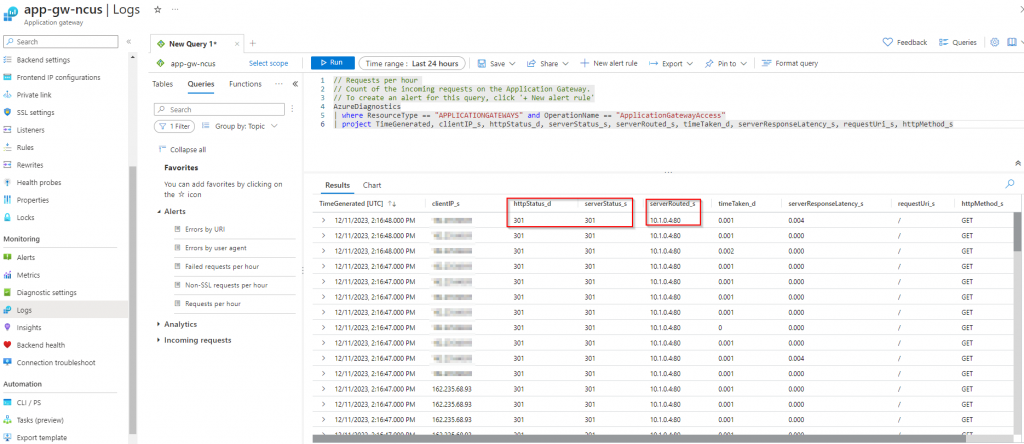
Using the query above we can filter logs to only show the columns we like to see, let us break them down:
- HTTP Status: This is the HTTP Status code (200, 301, 404, 504, etc.) that is returned from the application gateway to our client machines.
- Server Status: This is the HTTP status being returned from the backend server to the application gateway.
- Client IP: The Public IP of the client that initiated the request.
- Server Routed: The backend server that responded to the request.
- Time Taken: The total time it took to process and respond to the request.
- Server Response latency: The amount of time the backend server took to process the request.
- Request Uri: The URI requested by the client.
- HTTP Method: The type of HTTP request method used by the client (GET, POST, PUT, DELETE, etc.)
So what can we conclude based on these logs? If we take a look at the columns highlighted in red above, we will see the backend server (server routed) is the one responding with a redirection (server status 301), in this case, the application gateway is merely passing on the information to the client (HTTP status). We go back to our dev’s team and let them know our findings, upon checking the web server’s configuration they find redirection to HTTPS has been configured in the server’s config:
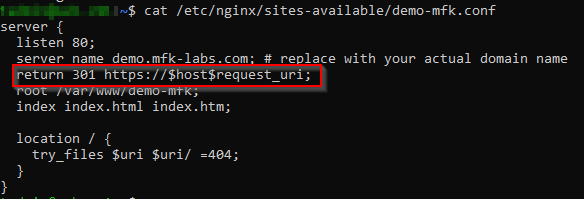
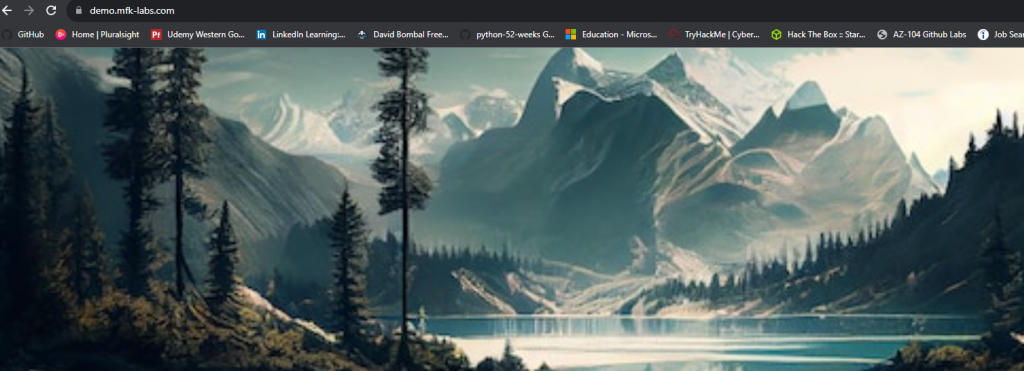
Apparently, there was a misunderstanding and the redirection should’ve been configured in the Application Gateway and not in the backend server… Oh well, upon removing the redirection line from the web server and refreshing our browser our issue is resolved!
What can we learn from the previous exercise? We can confidently say Curl helped us to quickly verify all layers up to 6 were healthy as we could complete a TCP and TLS handshake while also ensuring the server certificates were up to date, all this without having to take a packet capture or decrypt TLS 1.3.
Other queries you could use for curl in different scenarios include:
- Basic connectivity test:
- Command:
curl -svo /dev/nullhttps://demo.mfk-labs.com - Expected result: Exit code 0 and no errors.
- Possible issues/scenarios:
- No internet connection.
- DNS resolution failure.
- Website server is down.
- Command:
- Check specific page:
- Command:
curl -svo /dev/null https://demo.mfk-labs.com/specific-page - Expected result: Exit code 0 and no errors.
- Possible issues/scenarios:
- Specific page issues (e.g., code error, resource not found).
- Server overload affecting certain pages.
- Command:
- Test with different protocols:
- Command:
curl -svo /dev/nullhttps://demo.mfk-labs.com (for HTTP) - Expected result: Exit code 0 and no errors.
- Possible issues/scenarios:
- Website only accessible via HTTPS.
- Misconfiguration on server or load balancer.
- Command:
- Measure response time:
- Command: curl -o /dev/null -s -w ‘Total: %{time_total}s\n’ https://demo.mfk-labs.com/
- Expected result: Response time within an acceptable range (e.g., < 2 seconds).
- Possible issues/scenarios:
- Server overloaded with requests.
- Slow database queries.
- Network congestion.
- Make a continuous connection loop every 5 seconds:
- Command: while true; do curl -svo /dev/null https://demo.mfk-labs.com | grep -v HTTP; sleep 5; done
- Expected result: Exit code 0 and no errors.
- Possible use cases:
- The issue is intermittent.
- Load testing.
That was fun, thanks for the help CURL!
OpenSSL: OpenSSL command-line tools provide a rich set of utilities for performing various cryptographic tasks and managing security aspects. They are used for generating keys, managing certificates, encrypting and decrypting data, verifying signatures, and testing secure communication protocols. This command can be especially beneficial when troubleshooting TLS/SSL issues related to certificates, versions, and ciphers. Let’s get down to business and see how can we use them for troubleshooting.
There are two commands that I like to keep handy for troubleshooting TLS certs, these are:
openssl s_client -connect 10.0.2.20:443 -servername grootweb.cyberlab.org -showcerts

# and

openssl x509 -in cert.pem -noout -text
The first command (openssl s_client) allows you to connect as a web client to web servers and validate current certificates. The -connect option allows you to define what IP or FQDN you would like to connect, you could use it to connect directly to your desired website (ex: openssl s_client -connect google.com:443) in the above case I combined it with the -servername option, this option allows you to define a different SNI (Server Name Indication) when connecting to your destination server, this can be useful in testing environments or when connecting to a reverse proxy hosting multiple websites, you can think about it, similarly to changing your host file (c:\windows\system32\drivers\etc\hosts or /etc/hosts) to point any IP to a defined FQDN. Finally the -showcerts option returns to output all TLS/SSL certificates (Root, intermediate, and leaf/server) this can help download and validate the certificates further with our following command (openssl x509 -in cert.pem -noout -text). How does this look? Let’s try this together:
If I run openssl s_client -connect 10.0.2.20:443 -servername grootweb.cyberlab.org -showcerts against my local web server which uses a self-signed certificate, I get the following output:
CONNECTED(00000003)
depth=0 CN = WIN-H77S2N2OG0I
verify error:num=20:unable to get local issuer certificate
verify return:1
depth=0 CN = WIN-H77S2N2OG0I
verify error:num=21:unable to verify the first certificate
verify return:1
---
Certificate chain
 0 s:CN = WIN-H77S2N2OG0I
   i:CN = WIN-H77S2N2OG0I
-----BEGIN CERTIFICATE-----
<certificate content>
-----END CERTIFICATE-----
---
Server certificate
subject=CN = WIN-H77S2N2OG0I

issuer=CN = WIN-H77S2N2OG0I

---
No client certificate CA names sent
Peer signing digest: SHA256
Peer signature type: RSA
Server Temp Key: ECDH, P-384, 384 bits
---
SSL handshake has read 1290 bytes and written 471 bytes
Verification error: unable to verify the first certificate
---
New, TLSv1.2, Cipher is ECDHE-RSA-AES256-GCM-SHA384
Server public key is 2048 bit
Secure Renegotiation IS supported
Compression: NONE
Expansion: NONE
No ALPN negotiated
SSL-Session:
    Protocol  : TLSv1.2
    Cipher    : ECDHE-RSA-AES256-GCM-SHA384
    Session-ID: 65280000CD8D70BA97387140A9BB8FCDF5BAB6C580C76C7CCE1B2174FF05D055
    Session-ID-ctx:
    Master-Key: C23EC268AC09B3FC1FBB0B539D18DD9820FA37158115B258DD6A71A772FD199A7B317F0B76105BD4535A858BB547159A
    PSK identity: None
    PSK identity hint: None
    SRP username: None
    Start Time: 1704246694
    Timeout   : 7200 (sec)
    Verify return code: 21 (unable to verify the first certificate)
    Extended master secret: yes
Based on this we can confirm the issuer CN (Common Name) is the same as Subject CN (Website’s name) and that we get an error “Unable to verify the first certificate”. Why is that? Well, to keep it short and simple for the sake of this post, whenever a client initiates a TLS connection, one of the steps is to validate if a certificate is secure, this means if it is signed and trusted by a known/trusted Certificate Authority (CA) think Digicert, GeoTrust, GloabSign, VeriSign, etc.
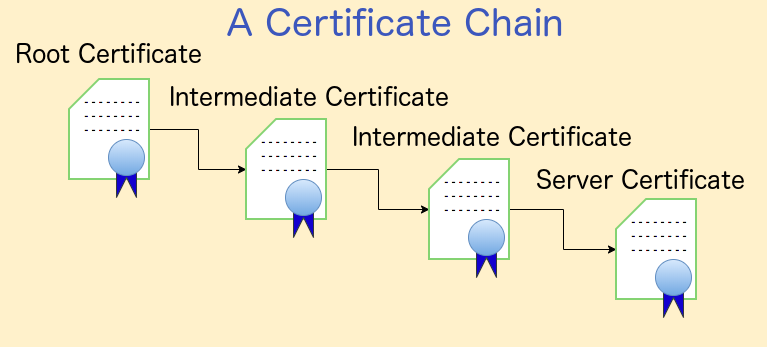
The way this occurs is by verifying the certificate chain and if the server’s certificate is signed by a root CA. Root CAs are important and sensitive servers, hence they tend to not be accessible to the public, this is the reason why there are intermediate certificates and intermediate cert authorities, I like to think of this as an analogy:
Imagine the root CA as the king, wielding immense power but needing trusted advisors. Intermediate CAs act as these advisors, handling smaller tasks like issuing certificates to commoners. This division of responsibility keeps the king safe and ensures the smooth operation of the kingdom (the internet).

Now with that being established, a healthy certificate chain should return us with at least 3 certificates whenever we run our OpenSSL command (Each certificate is the content between —–BEGIN CERTIFICATE—– and —–END CERTIFICATE—–), for instance when running openssl s_client -connect www.google.com:443 -servername www.google.com -showcerts we get the following output:
CONNECTED(00000003)
depth=2 C = US, O = Google Trust Services LLC, CN = GTS Root R1
verify return:1
depth=1 C = US, O = Google Trust Services LLC, CN = GTS CA 1C3
verify return:1
depth=0 CN = www.google.com
verify return:1
---
Certificate chain
 0 s:CN = www.google.com
   i:C = US, O = Google Trust Services LLC, CN = GTS CA 1C3
-----BEGIN CERTIFICATE-----
<redacted>
-----END CERTIFICATE-----
 1 s:C = US, O = Google Trust Services LLC, CN = GTS CA 1C3
   i:C = US, O = Google Trust Services LLC, CN = GTS Root R1
-----BEGIN CERTIFICATE-----
<redacted>
-----END CERTIFICATE-----
 2 s:C = US, O = Google Trust Services LLC, CN = GTS Root R1
   i:C = BE, O = GlobalSign nv-sa, OU = Root CA, CN = GlobalSign Root CA
-----BEGIN CERTIFICATE-----

<redacted>
-----END CERTIFICATE-----
---
Server certificate
subject=CN = www.google.com

issuer=C = US, O = Google Trust Services LLC, CN = GTS CA 1C3

---
No client certificate CA names sent
Peer signing digest: SHA256
Peer signature type: ECDSA
Server Temp Key: X25519, 253 bits
---
SSL handshake has read 4294 bytes and written 386 bytes
Verification: OK
---
New, TLSv1.3, Cipher is TLS_AES_256_GCM_SHA384
Server public key is 256 bit
Secure Renegotiation IS NOT supported
Compression: NONE
Expansion: NONE
No ALPN negotiated
Early data was not sent
Verify return code: 0 (ok)
One further test we can do is to copy the contents of the certificate chain from the first —–BEGIN CERTIFICATE—– to the last —–END CERTIFICATE—– into a text file with extension .pem and we can both validate and confirm more details of the certificate with our second OpenSSL command:
touch google-certs.pem # Create empty file
nano google-certs.pem # Open/edit our empty file
<Now copy the contents from the first -----BEGIN CERTIFICATE----- to the last -----END CERTIFICATE----- obtained from our previous command>
<Click CTRL + X and then type y to save the file>
openssl x509 -in google-certs.pem -noout -text # Our 2nd OpenSSL command
If you’ve followed this exercise along with me, you should see a similar output from the 2nd OpenSSL command:
Certificate:
    Data:
        Version: 3 (0x2)
        Serial Number:
            31:22:c5:f3:b7:e2:a9:db:09:e1:3a:37:c5:4c:a7:4d
        Signature Algorithm: sha256WithRSAEncryption
        Issuer: C = US, O = Google Trust Services LLC, CN = GTS CA 1C3
        Validity
            Not Before: Nov 20 08:09:47 2023 GMT
            Not After : Feb 12 08:09:46 2024 GMT
        Subject: CN = www.google.com
        Subject Public Key Info:
            Public Key Algorithm: id-ecPublicKey
                Public-Key: (256 bit)
                pub:
                    04:32:38:74:92:35:5a:1d:03:f4:46:29:07:a0:87:
                    2a:ec:14:d4:da:91:5d:da:bb:c3:5f:47:43:98:f5:
                    78:62:c7:61:3f:30:48:6f:52:31:df:ab:9d:4c:5c:
                    dd:3f:97:ee:ad:e0:a9:35:ab:9c:34:41:68:88:6a:
                    9e:c7:52:bb:26
                ASN1 OID: prime256v1
                NIST CURVE: P-256
        X509v3 extensions:
            X509v3 Key Usage: critical
                Digital Signature
            X509v3 Extended Key Usage:
                TLS Web Server Authentication
            X509v3 Basic Constraints: critical
                CA:FALSE
            X509v3 Subject Key Identifier:
                37:C4:63:A2:97:D1:56:79:BF:20:D7:D8:34:92:38:97:53:05:D2:50
            X509v3 Authority Key Identifier:
                keyid:8A:74:7F:AF:85:CD:EE:95:CD:3D:9C:D0:E2:46:14:F3:71:35:1D:27

            Authority Information Access:
                OCSP - URI:http://ocsp.pki.goog/gts1c3
                CA Issuers - URI:http://pki.goog/repo/certs/gts1c3.der

            X509v3 Subject Alternative Name:
                DNS:www.google.com
            X509v3 Certificate Policies:
                Policy: 2.23.140.1.2.1
                Policy: 1.3.6.1.4.1.11129.2.5.3

            X509v3 CRL Distribution Points:

                Full Name:
                  URI:http://crls.pki.goog/gts1c3/fVJxbV-Ktmk.crl

            CT Precertificate SCTs:
                Signed Certificate Timestamp:
                    Version   : v1 (0x0)
                    Log ID    : 76:FF:88:3F:0A:B6:FB:95:51:C2:61:CC:F5:87:BA:34:
                                B4:A4:CD:BB:29:DC:68:42:0A:9F:E6:67:4C:5A:3A:74
                    Timestamp : Nov 20 09:09:48.448 2023 GMT
                    Extensions: none
                    Signature : ecdsa-with-SHA256
                                30:45:02:21:00:EF:3E:86:86:BB:04:BF:49:58:4B:53:
                                63:51:C4:CD:78:45:22:B6:D3:EA:EF:9B:78:A2:F0:F5:
                                C2:AC:4A:8B:83:02:20:66:A4:7A:77:9F:14:BC:96:C5:
                                A8:22:3A:0A:76:C9:94:AC:C0:45:83:47:D9:07:BF:AB:
                                E5:58:1A:79:D1:17:90
                Signed Certificate Timestamp:
                    Version   : v1 (0x0)
                    Log ID    : 55:81:D4:C2:16:90:36:01:4A:EA:0B:9B:57:3C:53:F0:
                                C0:E4:38:78:70:25:08:17:2F:A3:AA:1D:07:13:D3:0C
                    Timestamp : Nov 20 09:09:48.423 2023 GMT
                    Extensions: none
                    Signature : ecdsa-with-SHA256
                                30:44:02:20:2B:19:09:75:58:4E:3E:AB:02:4C:44:44:
                                A3:4E:29:52:94:13:05:27:F4:07:12:74:04:DA:9E:11:
                                85:81:6D:EE:02:20:0F:BC:D8:01:8A:D7:13:2C:70:5C:
                                04:6B:57:A7:FD:EB:BD:22:BD:47:F3:B8:1A:85:A0:95:
                                12:D6:6C:BB:67:C2
    Signature Algorithm: sha256WithRSAEncryption
         7e:77:aa:a0:d4:6c:90:af:bd:45:b6:b7:46:ef:31:6d:4d:ec:
         dd:71:9e:0f:d5:85:74:c6:38:6c:1b:34:5e:47:1d:e9:85:c6:
         90:cb:eb:eb:39:9f:08:f6:dd:4d:32:df:18:0e:3d:15:cf:39:
         91:45:c2:41:80:e6:a1:47:61:f4:d1:49:4b:a9:1f:46:d1:f7:
         e8:33:aa:d9:f5:e1:53:8e:db:7c:2e:9d:8b:53:08:c3:8a:01:
         28:20:61:c1:53:10:ba:dd:ac:c8:19:d5:01:4c:24:3d:f9:4a:
         80:58:be:e6:d6:a0:aa:93:23:ed:87:60:e6:41:3a:f4:18:9e:
         7b:ac:0a:9e:4e:33:62:5b:d4:ce:80:56:85:e7:98:6a:24:0d:
         b0:a7:9b:70:26:1a:04:cb:67:76:20:65:f5:b1:77:5b:94:a1:
         02:25:d8:95:9a:bf:90:df:41:f6:e7:28:d2:fd:0e:76:f6:48:
         1f:47:39:bf:09:72:55:71:16:e9:78:3c:a9:bf:3d:a7:7e:fd:
         cb:67:76:7d:75:0d:ea:d8:db:67:58:04:d4:b5:8c:6b:33:70:
         91:28:5d:3e:f0:ce:c7:58:4b:e4:c0:64:92:1a:11:a5:4b:8a:
         29:fb:88:f4:3a:3d:47:9e:ce:c2:3d:78:a6:6c:67:45:f4:77:
         4a:c4:d1:d7
I highlighted some information I found interesting such as the OCSP, CA Issuers, CRL, expiration date, subject name CN, and alternative names.
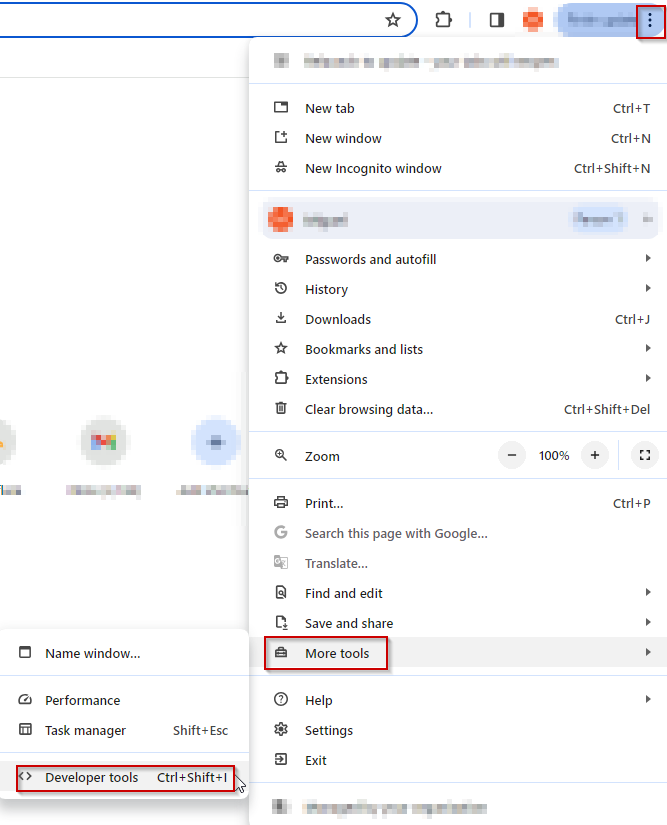
Dev-tools: This is a tool you may’ve seen or used before and one of my favorite ones for its ease of use. Dev-tools is available in all major web browsers, you can open it in either Edge or Chrome by going to the 3 dots (. . .) > More tools > Developer Tools or by clicking CTRL + Shift + i
There are many things you can do with dev tools, but for this post, we will focus on the “Network” tab.
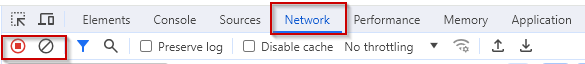
You will probably see a few results/URLs already loaded, you can clear this by using the clear button highlighted in the screenshot above, then you can browse to your desired website and record the results, for example:
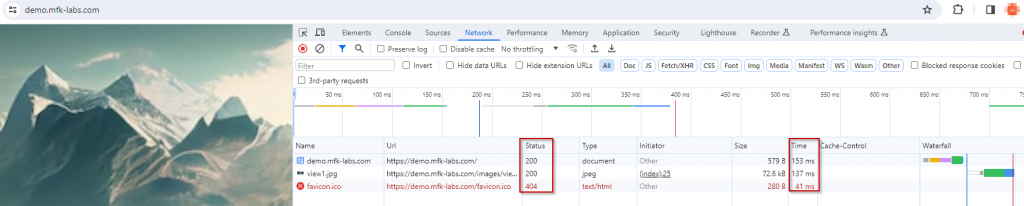
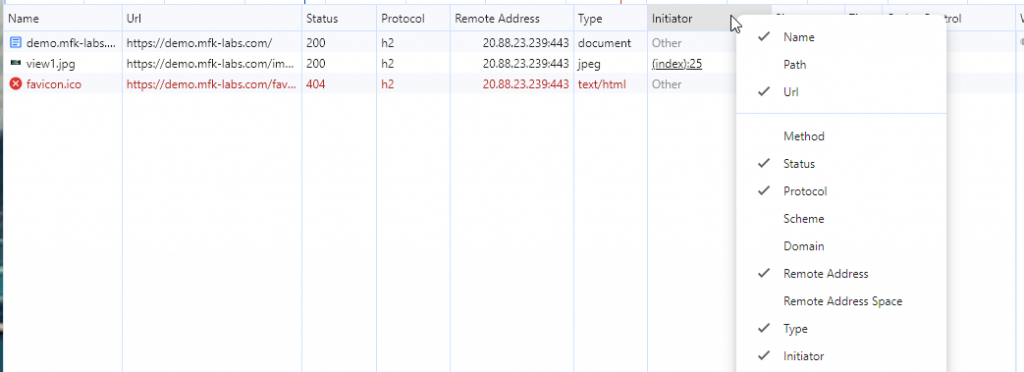
This will give you lots of useful information, including the HTTP status, time to load, cache-control setting, size, and name for each of the URLs called when connecting to your website (demo.mfk-labs.com in this example), based on this information you can identify if any component is failing or taking a long time to load, what is the status it is returning (404 not found, 504 timeouts, 5xx error servers, 403 forbidden, etc.) and then troubleshoot it accordingly now that is narrowed down.
Once you’ve captured/reproduced your issue, you can export it as a HAR file, this can be shared with and opened by other members of your team for brainstorming and for a better understanding of an issue.
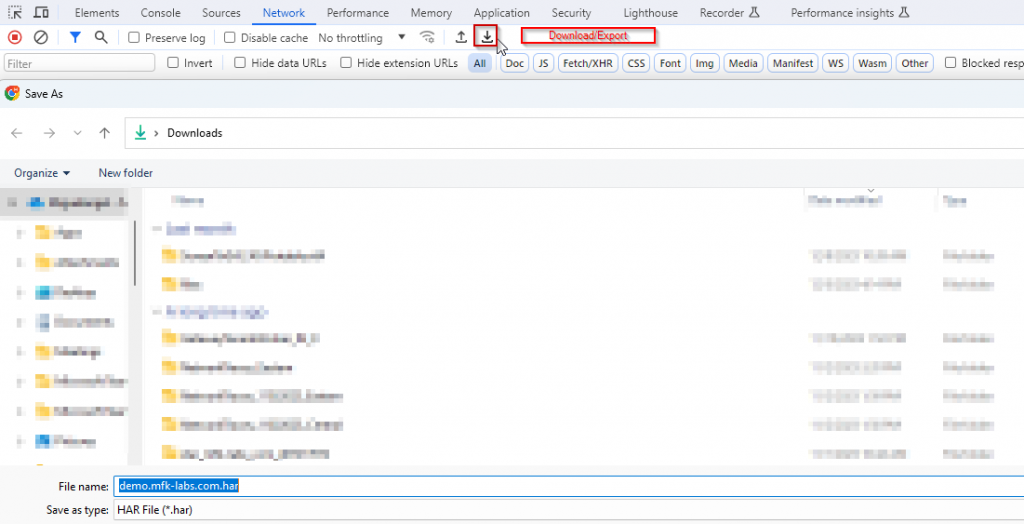
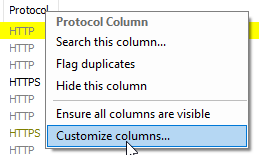
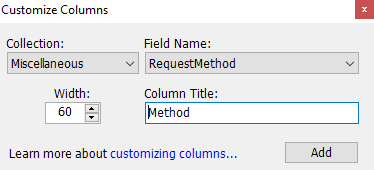
Tip: You can add custom columns to get additional information by right clicking any of the current columns. I always like to add the remote address column, protocol, and method.
Dev-tools is great when working with web app pages but what happens if we are troubleshooting a desktop application? Well, let’s present our next tool.
Fiddler: This is a wonderful debugging and troubleshooting tool for application layer issues, very similar to dev-tools fiddler allows us to capture web session and call information whenever we are connecting to any web or desktop application. There are multiple versions of Fiddler, for this post I will download and use Fiddler Classic, which is the free Windows version of Fiddler, you may download it here.
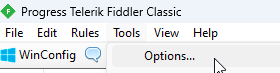
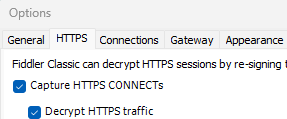
Once you download Fiddler, we will need to adjust a few settings before getting started, first, we will go to Tools > Options > HTTPS and mark the option “Decrypt HTTPS traffic”.
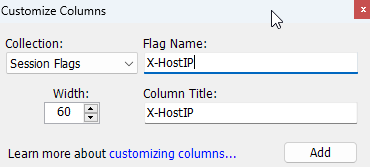
And similar to dev-tools I like to add a few columns, specifically one to show the remote web server’s IP address.
Tip: You can import HAR captures like the one taken previously with dev-tools into Fiddler, one easy way to do that is by dragging the file into Fiddler or by clicking File > Import Sessions > HTTPArchive.
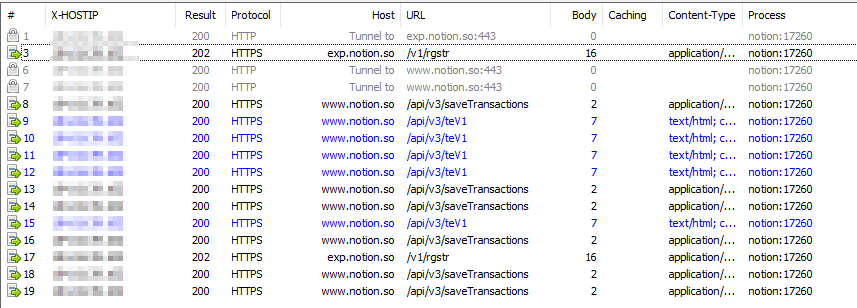
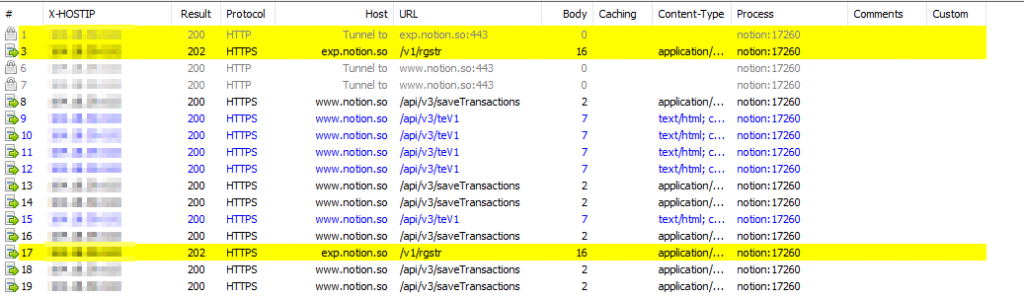
To demonstrate one of the uses of Fiddler, I will open Notion which is a note-taking desktop app, and type some content while having Fiddler in capture traffic mode (File > Capture Traffic). After opening Notion and typing a few characters we can see some requests going to Notion URLs:
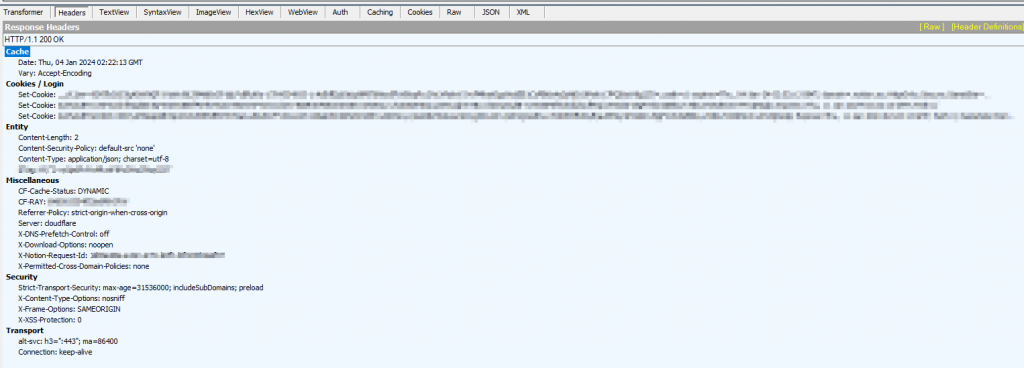
If we click on each of these requests we can get more information about them, under the “Inspectors” tab I usually like to take a look at the headers and Raw columns:
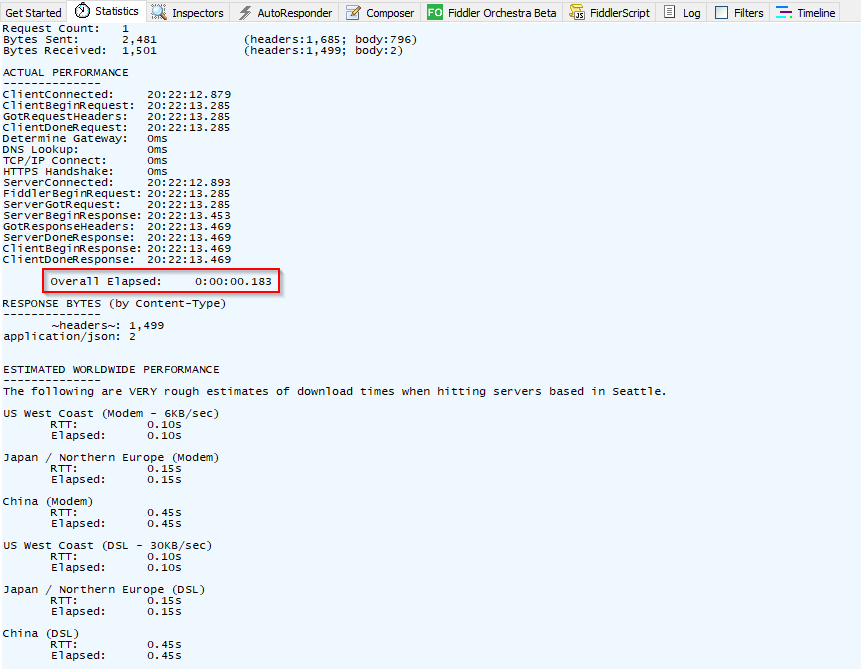
The “statistics” tab contains useful information especially when troubleshooting slow requests to specific URLs as we can see the total time elapsed for each request and what part of the connection (TCP/IP, DNS, HTTPS, etc.) made up for that time:
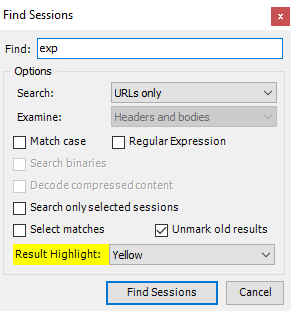
If you’re looking to filter any sessions, for example by IP or URL you can use the search function in Edit > Find Sessions, these will be highlighted:
And that’s it! We’ve come to the end of this session, I hope that you had a good time reading and also that you may have learned something interesting, new, or useful today. This will be the last part of this series of network tools and troubleshooting, I may add some new bits to it if I run across anything worth adding. As always, thank you so much for reading, and wish you the very best in your IT and networking journeys, I will see you here next time with a new post at MFK Labs! 😉