Hey there and welcome to the fourth part of this blog series! You may find the previous parts below:
- First part – Troubleshooting connectivity (Layer 4 TCP/IP)
- Second part – Troubleshooting latency, performance, and throughput
- Third part – Troubleshooting DNS
In this fourth episode, we will be talking about:
- Packet analysis
Packet analysis, loved by some, feared by many(? If you have been in this field for a while the possibility that you’ve encountered occasions, where packet captures (sometimes called network traces) and analysis was needed, is HUGE. You may have even downloaded and opened Wireshark yourself, looked at it populating a lot of packet logs, and felt overwhelmed by it. I had been there at least, the truth is, packet captures are your best friend as a Network Engineer, and by customizing Wireshark to help you a bit and of course by practicing it you will become adept and proficient at reading captures, troubleshooting network and application issues, and more importantly keeping the blame out of your network 😋.
When would you need to do a packet capture? There are many scenarios where you would probably like to do a packet capture, from slowness and performance issues, traffic being blocked or dropped, packet loss, intermittent connectivity issues, DNS resolutions/troubleshooting, database connections not working, and many many more. They are a great option to identify where and why is an issue occurring. We will be exploring some scenarios and use cases in a little bit. So let’s get started with this episode!
Wireshark: Wireshark is the de-facto and most well-known packet analyzer tool, it will work for both taking and analyzing network captures, it’s free, open-source, and counts with massive support and documentation from its users and creators.
How to install: First, go ahead, download Wireshark and install it. You may keep all the default options, you just click next through the installation wizard. Once, it’s installed, let’s go ahead and open it:
We should be received by a screen like this:
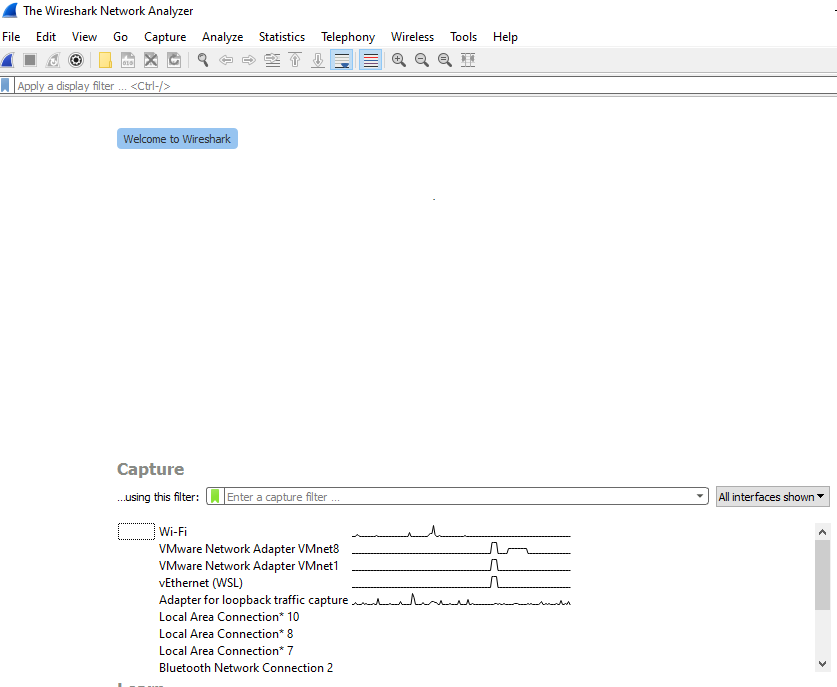
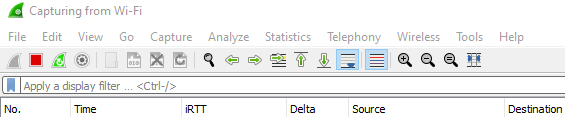
If we want to start a new capture, we can just double-click on any of our network interfaces here, for example, I will be using the Wi-Fi interface on my laptop.
If you do this, you will probably see and a lot of information/packets popping up in your Wireshark window. This is because Wireshark is logging and capturing all the network packets flowing in and out of our computer network. Let’s stop this for now by clicking on the top left “Stop” button.
Setup: Alright, so one of the things that will help simplify our capture analysis is customizing our Wireshark profile. This is a great video to help with this by Chris Greer on his YT channel (Can’t recommend Chris enough for anything that includes Wireshark).
First things first, let’s create a new profile:
On the bottom left > Right click Profile: Default > New.
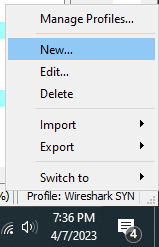
Add a name to your profile and save it.
For my own profile, these are some of the settings that I always make sure to include:
Add a delta column: The delta, also known as the delay time between packets is a fundamental column/value to consider for your network analysis, it indicates the amount of time passed from one packet to the other. To add this:
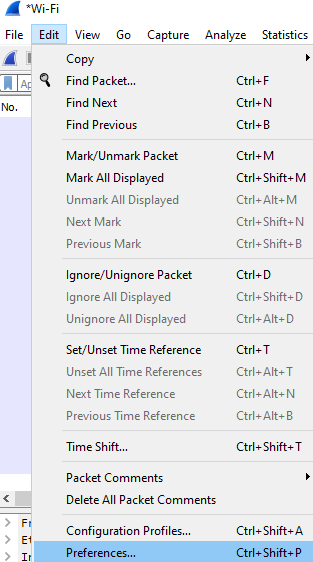
Click on Edit > Preferences > Appearance > Columns
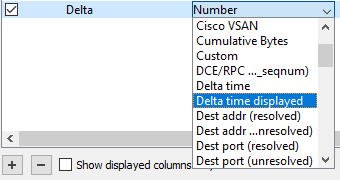
Add a new column by clicking the + button
Change the title of the newly added column to “Delta” and change the type value (double-click on it) to “Delta Time Displayed”.
You may change the order of the column by dragging and dropping it to your desired location.
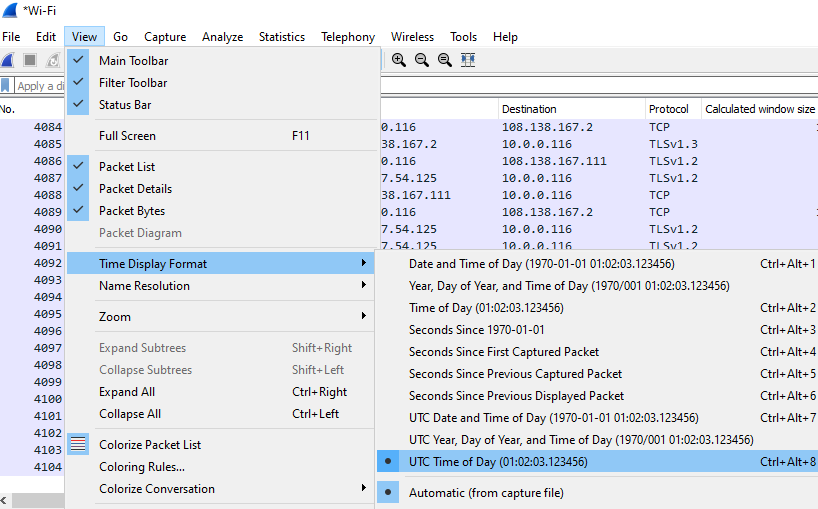
Change the time column: I like to use the UTC format.
Add color to your initial TCP handshake packets (SYN – SYN/ACK):
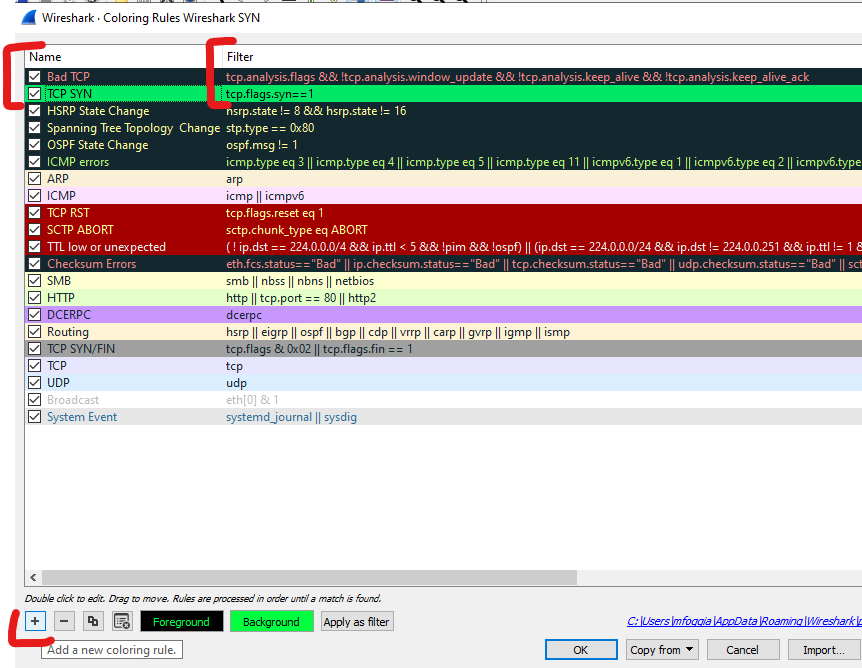
Click View > Coloring rules > Click the + sign on the bottom
Add a name Ex: TCP SYN
Add a filter: tcp.flags.syn==1
Drag TCP SYN rule under BAD TCP rule (This is to only show the first TCP SYN and SYN/ACK as green, any retransmissions will use the Bad TCP color).
Optional:
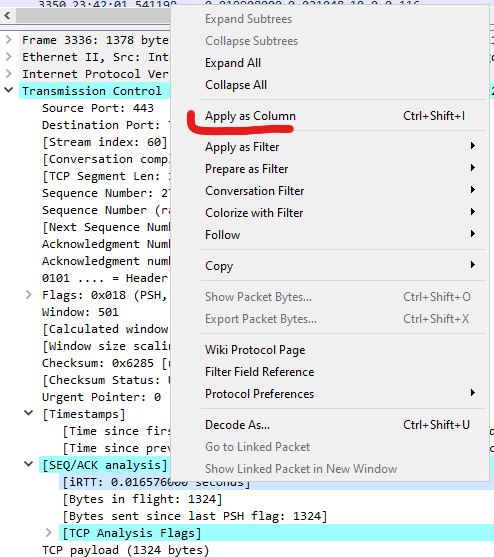
Add custom columns: In my case, I always like to add the iRTT (Round Trip Time), Sequence, and Acknowledgement numbers, one of the easiest ways to add a column, you may require, is by clicking on any packet, expanding the datagrams drop downs (Ethernet, IP, TCP, etc), right-click the column you will like to use > Apply as a column. For example:
Note: Make sure to export your customized profile so you can import it to any of your other devices. Right-click Profile > Export > Selected Profile.
Awesome! We have our Wireshark profile ready now, let’s get our hands dirty and start analyzing some captures with practical examples.
A practical example: One example I would like to use to demonstrate packet captures is whenever you’re browsing a website, for instance, I will use a test site hosted in an Azure App Service for this demonstration japan.mfk-labs.com.
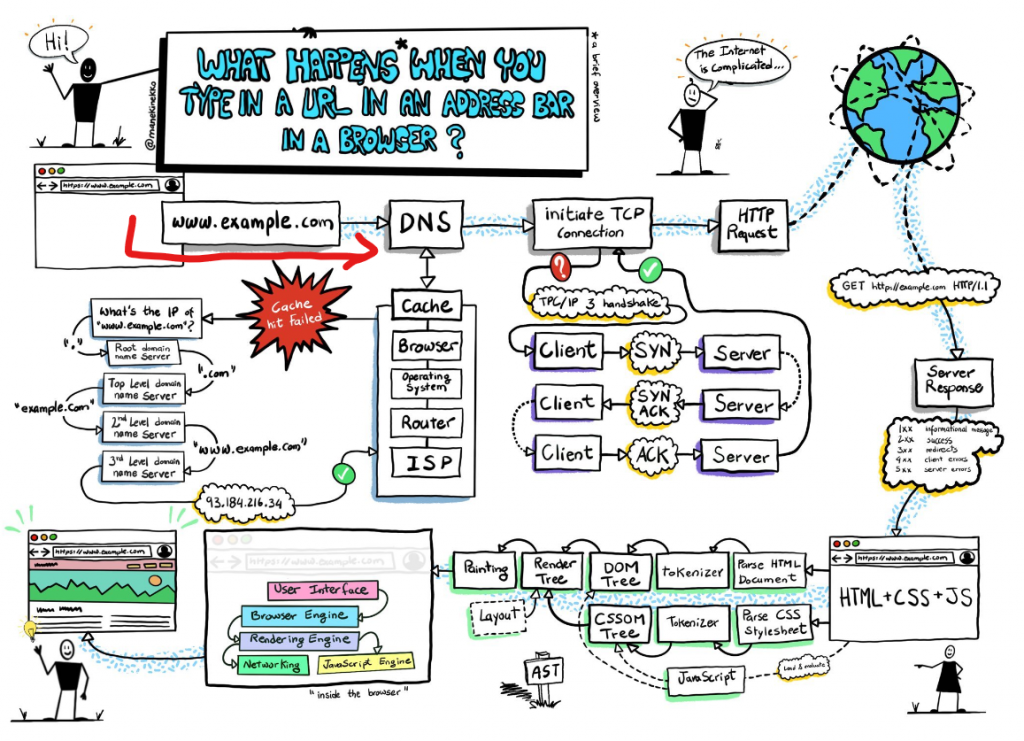
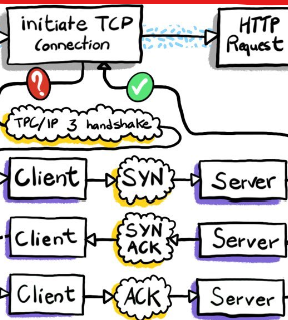
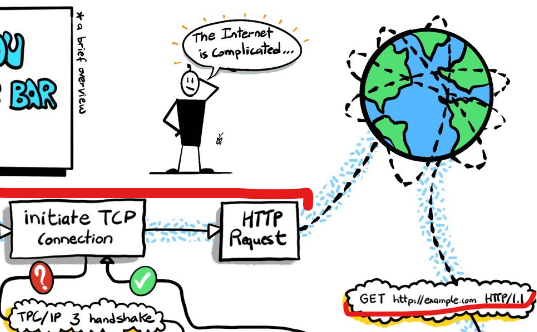
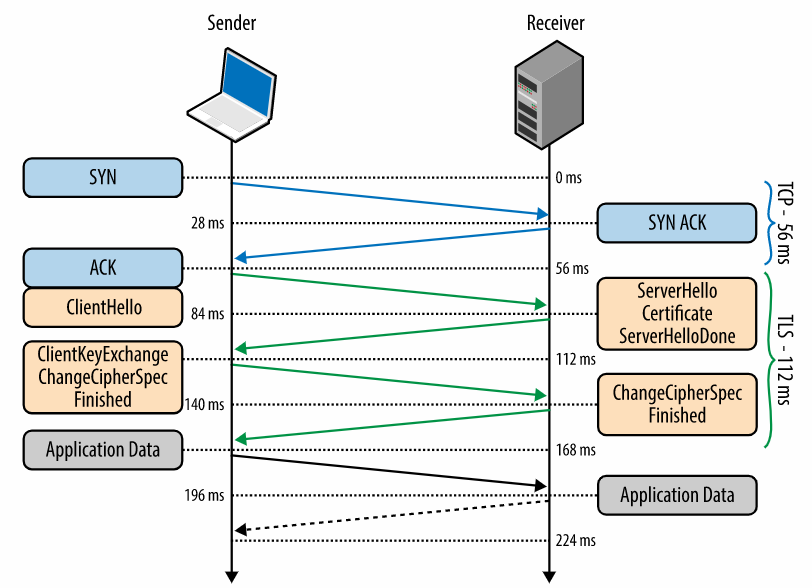
There are many things that must occur before you’re able to browse a website, roughly the traffic flow looks like this:
Browser —> URI –> DNS –> TCP –> HTTP –> TLS/SSL –> Application.
I will walk you through looking at and analyzing packets at each of these stages.
So, this is what we are going to do, first open Wireshark and start a new capture, open a website of your preference using your favorite browser (note: if you want to follow along with this exercise I recommend you choose a website that uses TLS 1.2 or you may need to capture session keys if you would like to see the server certificates in TLS 1.3), in my case I will use basilisk for this demo, then type in your search bar http://<replace_with_name_of_your_site>. And hit browse.

This should open your chosen website. When going to your site, there are a few things that may occur, you may notice a few redirections and even your URI may change, mine did:

Once you’ve opened your site, stop the Wireshark capture as we did before.
DNS: The first part of our conversation for this browsing exercise is DNS, whenever we browse a new page, a DNS request is sent by our computer’s browser to request the record associated with the website we are visiting.
To identify this in Wireshark, you could use the following display filters:
frame contains "japan"

# or if you only want to find the DNS request/response

dns.qry.name contains "japan.mfk-labs.com"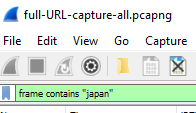
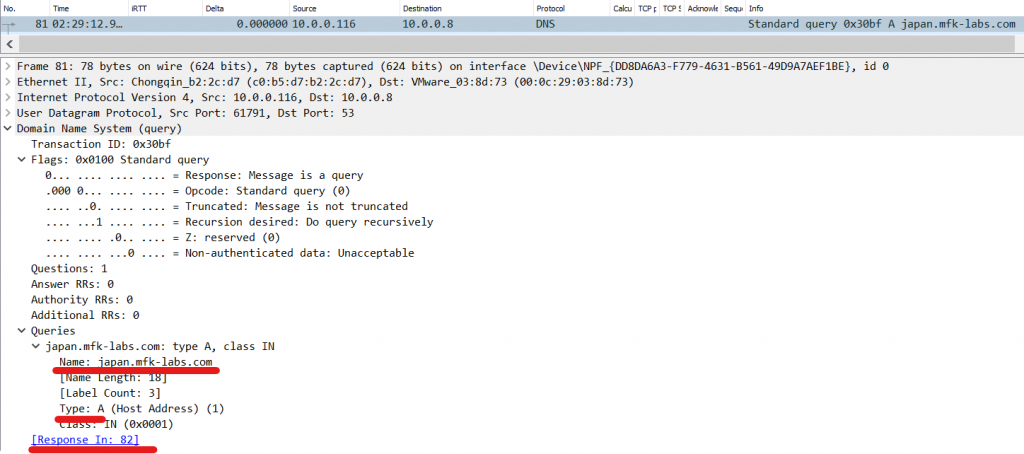
This should return the DNS requests sent by your browsing requesting the record for your site, in my example:
From source 10.0.0.116 (My PC) to 10.0.0.8 (My DNS server/forwarder).
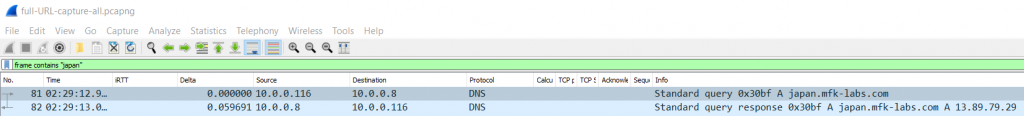
Clicking and expanding the first packet will allow us to see all the details for this DNS query. Including the type of record requested (A), the name we are looking for, and even in which packet is the response to this DNS query (Frame 82).
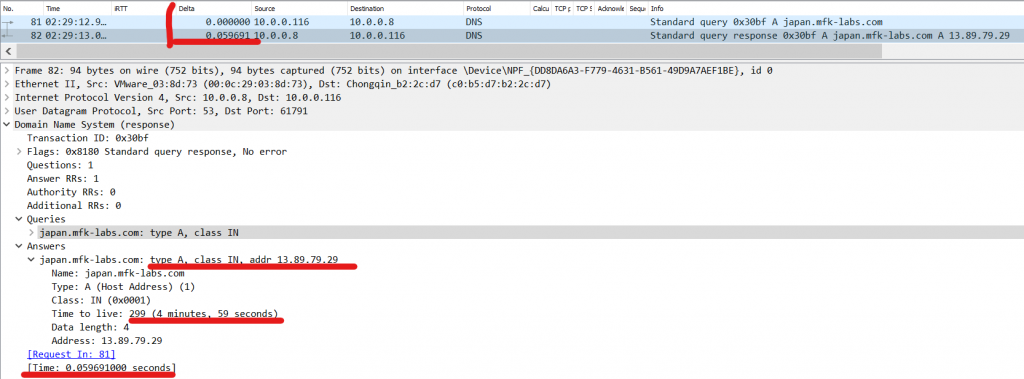
Looking at packet/frame 82, we can see the returned IP address to our query (13.89.79.23), the TTL of the record (how long it will stay in our PC’s cache), and even the time it took for this response to arrive (Notice this is the same time shown in our delta column 59 ms).
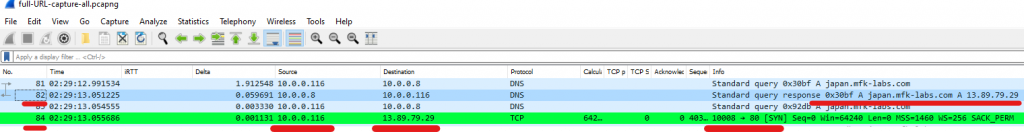
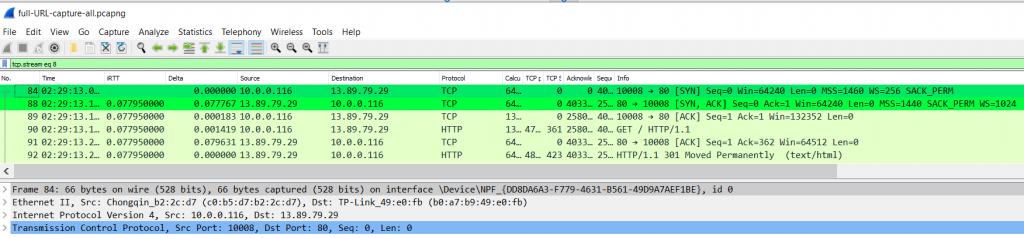
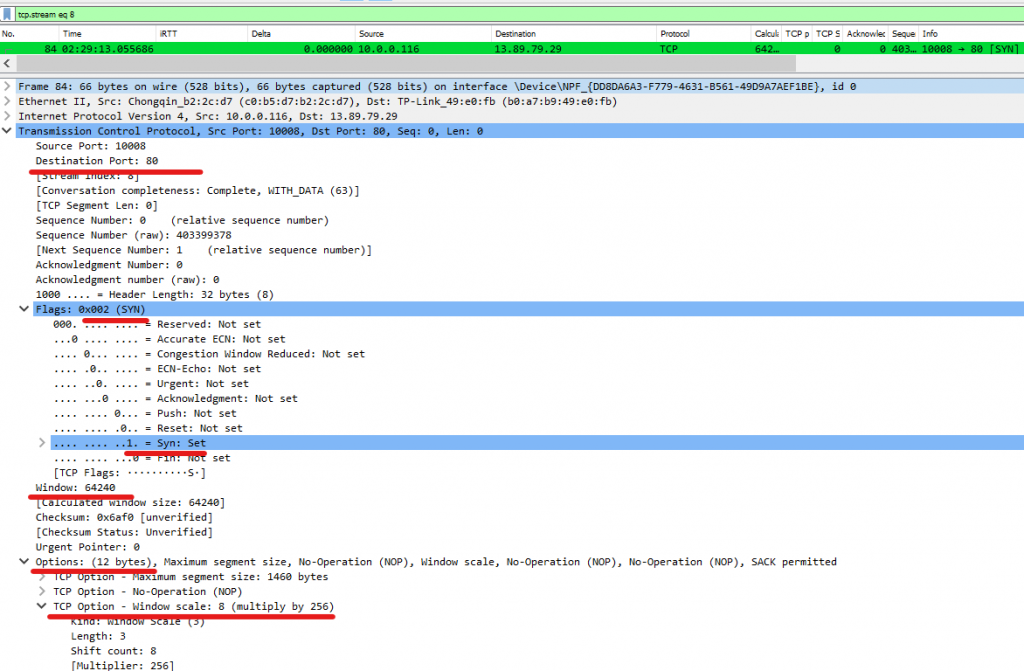
Chances are, if we click on the DNS response packet, and then clear our display filter, the next packet we will see will be from our PC sending the initial TCP SYN of our three-way handshake. In my case it’s the next packet (84), there we can see a TCP SYN being sent to the IP of our destination server in port 80 (HTTP).
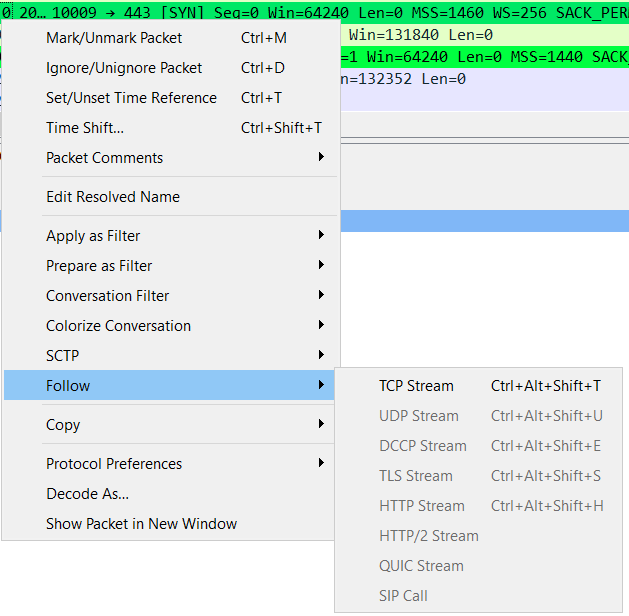
Once we identified a packet of our desired conversation, Wireshark will do the heavy lifting for us. How? Well, let’s right-click in our TCP SYN packet and then select > Follow > TCP Stream.
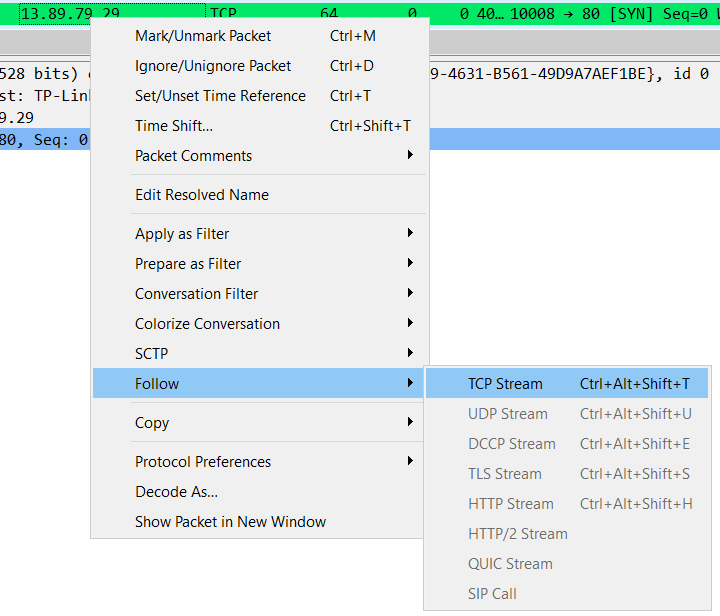
This will follow the full conversation between our PC and the visited website, and show all the relevant packets.
Neat! Now let’s look into the next part of our exercise.
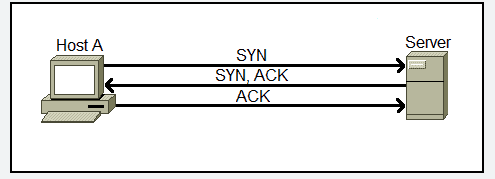
TCP: Transmission Control Protocol (TCP), is one of the main and most important pillars of computer networking for a reason. Designed in 1970, adopted by ARPANET, and eventually proceeding to be the networking king control protocol TCP is a beast! There’s a lot to say about TCP, but let’s just dig in and learn by using our captured example.
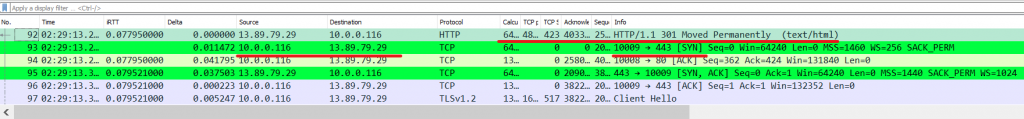
The first three packets in this conversation conform the famous 3-way handshake (SYN, SYN/ACK, ACK).
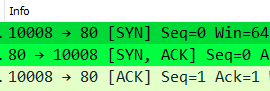
Expanding into each of these packets, especially the first two we can learn a LOT about a connection. Include the source/destination ports, the sequence numbers, flags used (Notice how there’s a 1 for the SYN flag which indicates its bit is turned, this is how computers can identify an SYN packet, the rest of the flags are 0 or turned off).
Other interesting values to keep in mind are the sequence number, TCP Window Size, and TCP options.
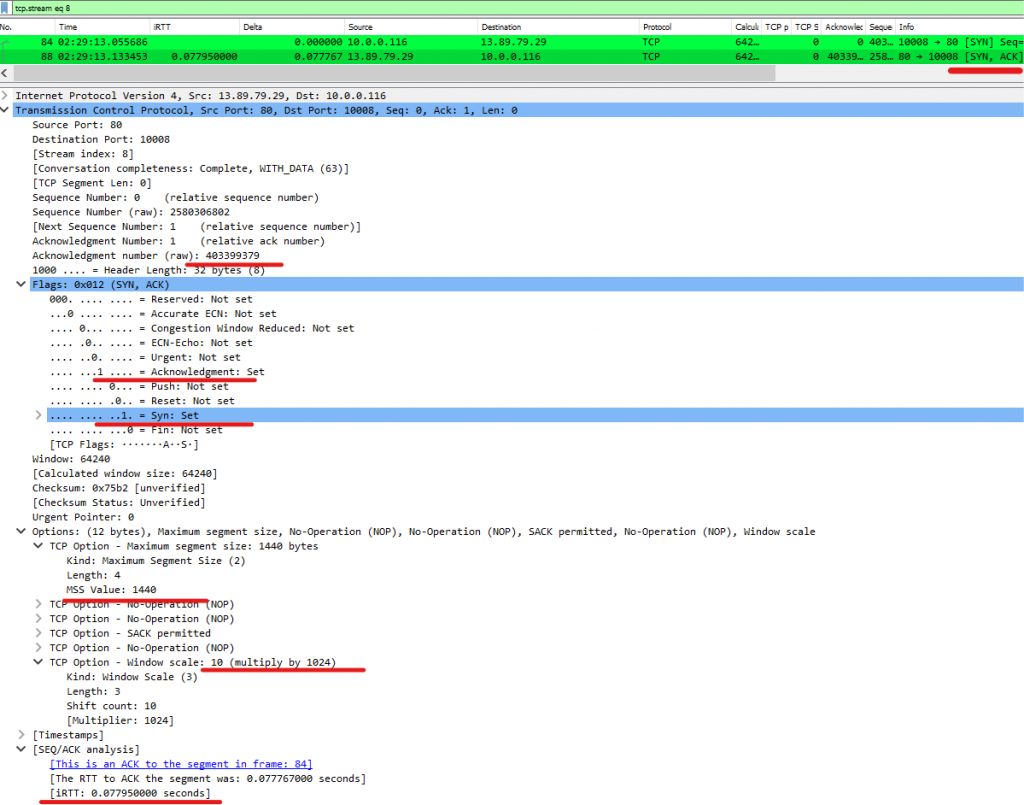
And here we can see our SYN/ACK.
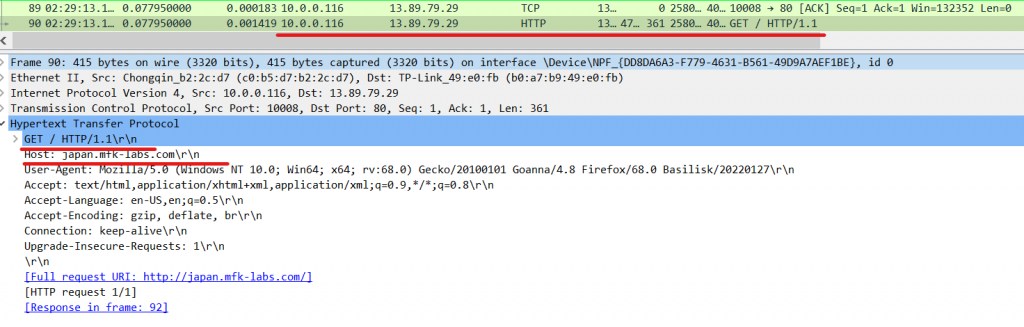
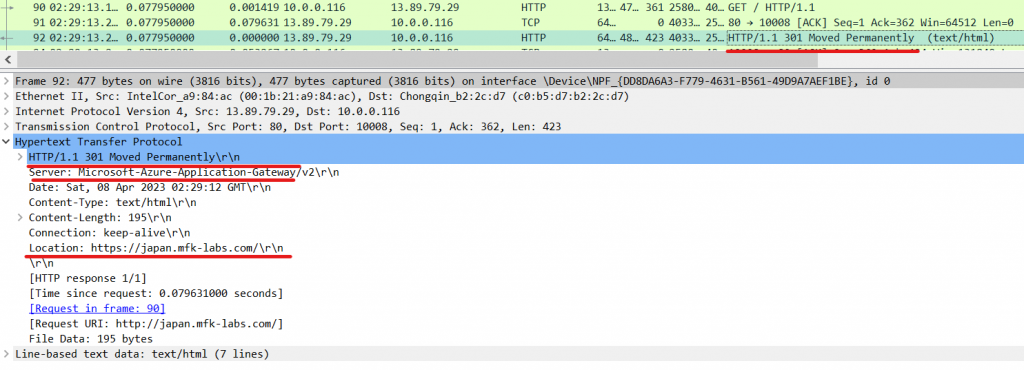
HTTP: Looking further into this conversation we can see that as soon as the ACK is completed and our 3-way handshake is established, the protocol in question (HTTP) starts its connection. It’s a GET request to request the content of the website we intend to visit.
Check out common HTTP request types.
A few packets later, we can see a response coming from our web server. With status code 301, a redirection, in the “location” value, we can see it is redirecting us to use HTTPS.
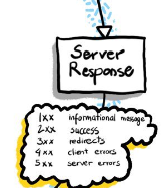
Common HTTP codes include:
- HTTP Status Code 200 – OK. …
- HTTP Status Code 301 – Permanent Redirect. …
- HTTP Status Code 302 – Temporary Redirect. …
- HTTP Status Code 404 – Not Found. …
- HTTP Status Code 410 – Gone. …
- HTTP Status Code 500 – Internal Server Error. …
- HTTP Status Code 503 – Service Unavailable.
TLS/SSL: So our machine is being redirected to use HTTPS, also known as HTTP Secure or HTTP over TLS/SSL (Transport Layer Security). This is a common and very good thing, all websites nowadays should use HTTPS, the reason is that HTTP is an un-encrypted plain-text protocol, and all the information transmitted over it can be observed in cleartext, this is a terrible idea as any ears-drover or man-in-the-middle that intercepts our communication can see all the information that we send or receive from our visited websites, for instance, let’s consider the output text we received after following our previous TCP stream.
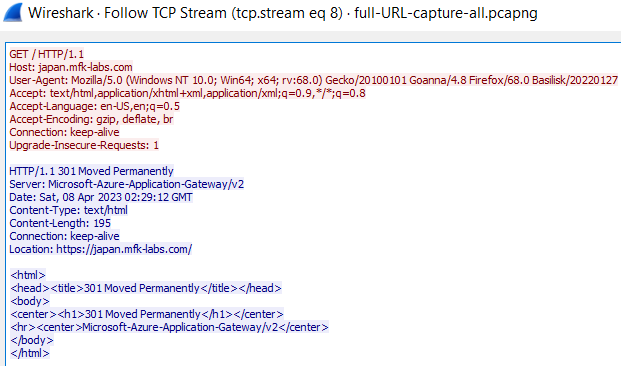
We can clearly see the request and response text sent and received from our website. If we typed and sent a password while using plain HTTP, this will also be observed here, such as in this example:
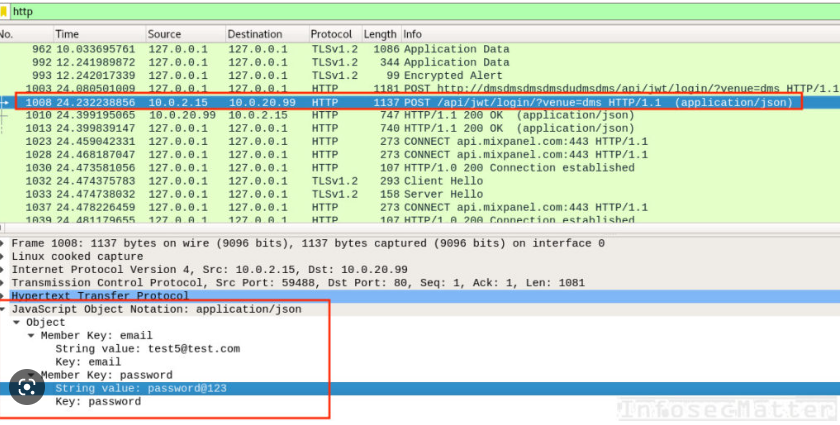
This is the reason, that whenever we browse using HTTP, most websites nowadays will redirect us to use HTTPS instead. Now, let’s look into our TLS packets and see what can we learn from them.
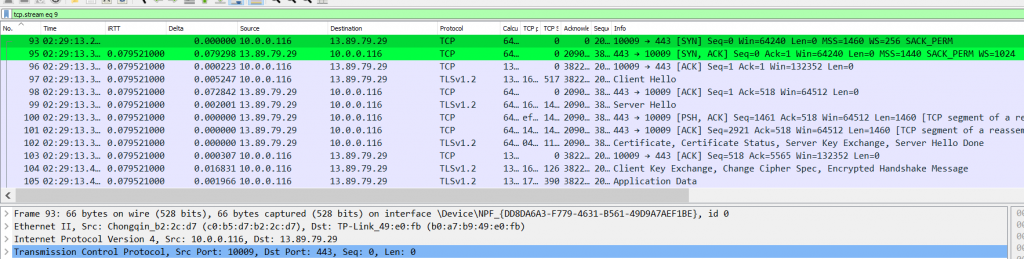
Doing the same thing we did to find our TCP stream from our DNS response, let’s click into the HTTP response packet and clear our display filter. There’s a high chance that you will find a new TCP connection being initiated from our PC to our website’s IP but this time use port 443 (HTTPS).
If we follow this conversation as we did before, we will find our TLS connection to our website, similar to this:
TLS/SSL is a beast on its own, and there are also many things we can talk about it, but I will try to keep it sweet and short for now.
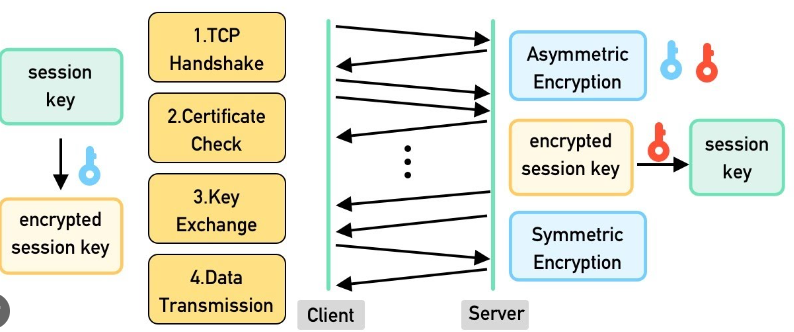
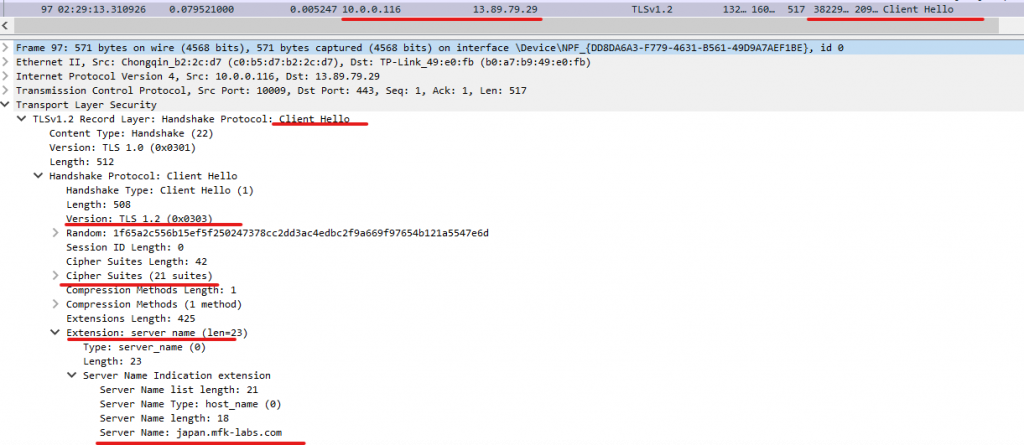
As soon, as our TCP handshake for port 443 is established, the next packet will be the “client hello”, this is something like the TCP SYN but in this case for our “TLS handshake”. We can expand into this packet and learn a handful amount of things about our connection such as the TLS version, cipher suites supported by our PC, and the Server Name Indication (SNI – This value represents essentially the hostname of the website we are requesting, in my case japan.mfk-labs.com):
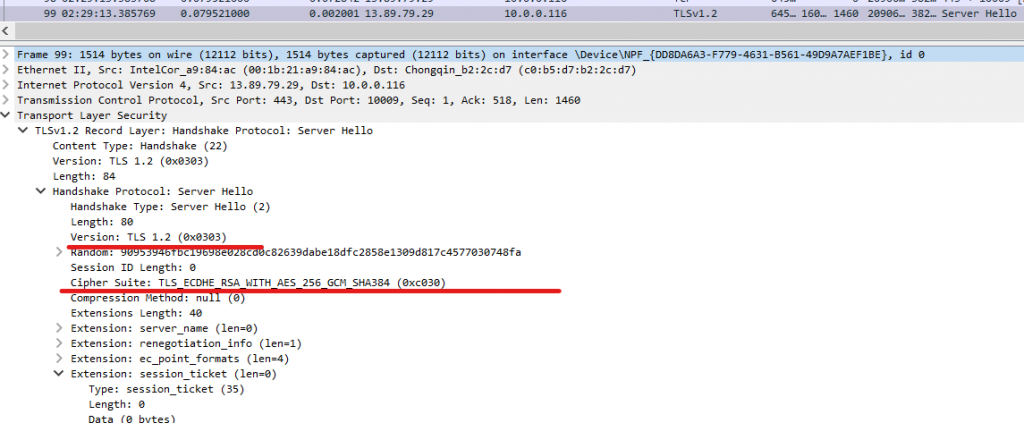
Our next interesting packet is the “Server hello”. In this packet, we can see what cipher suite was selected by our web server, the TLS version, and a bit more.
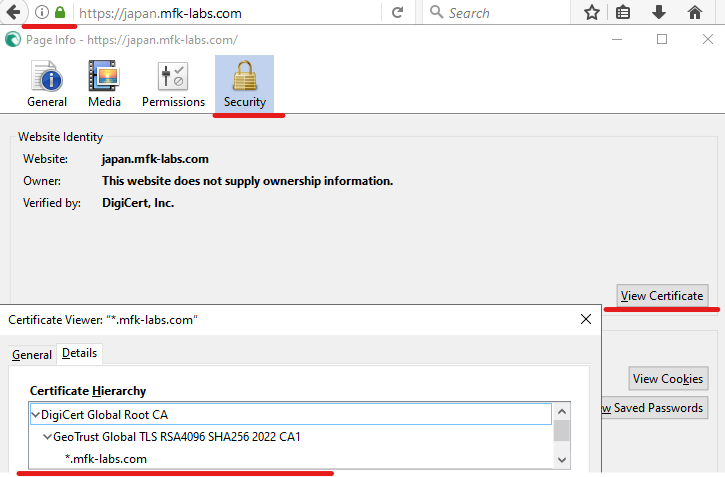
Sometimes, you may even find the actual security certificates used by the webserver to identify itself in this packet, at other times, you may find it in a different packet further down in the capture, like in my case:
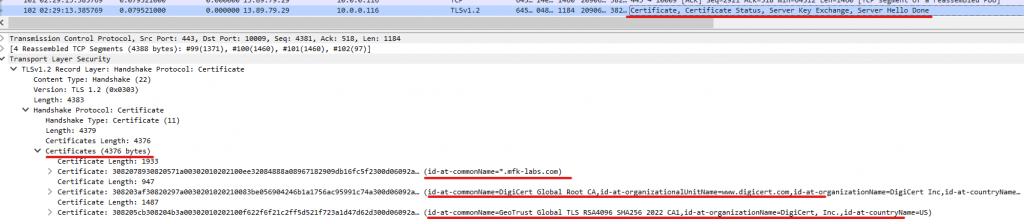
We can verify these are the same certificates by comparing them to the ones in our browser after landing on our webpage.
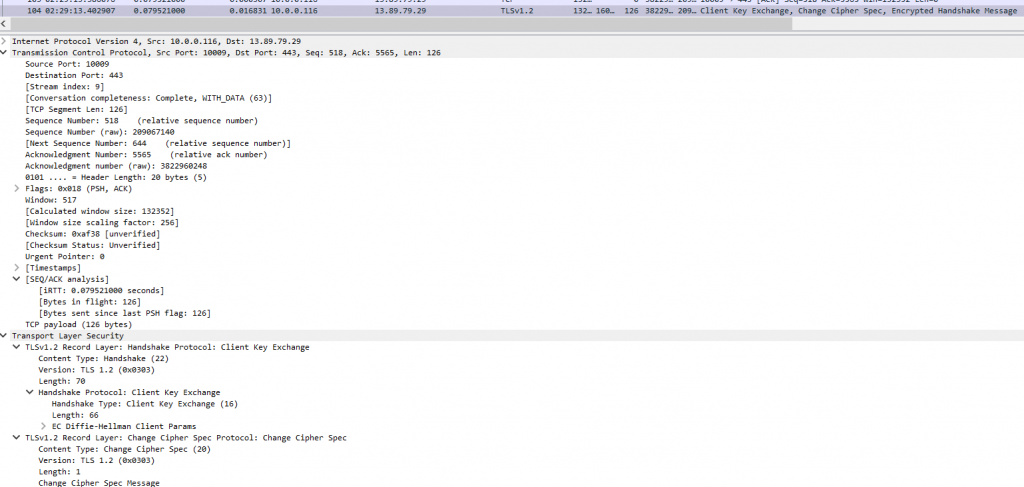
And finally the client key exchange packet:
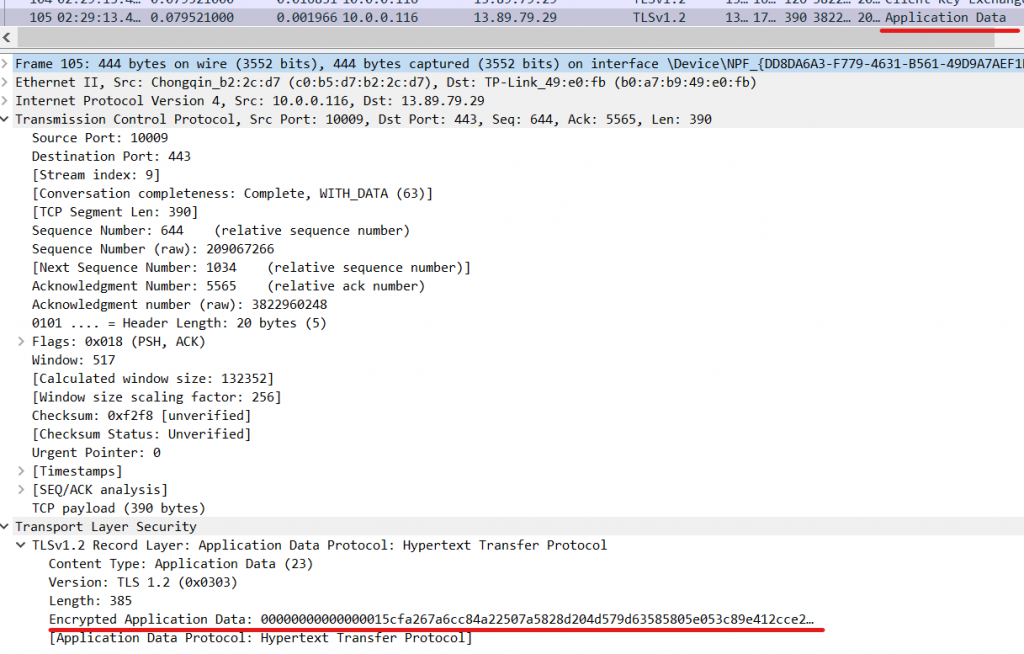
After these packets, we will probably see many packets with the words “Application data”. This means our TCP/TLS handshakes were completed successfully and now we are ready to send and receive encrypted data from our website!
More tips: Alright, that was a lot! Hopefully, you learned and explored how to use and feel a bit more comfortable using Wireshark to analyze network captures, I will drop a few more tips and scenarios to consider to drive these concepts home.
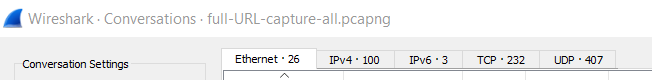
See conversations: You can check the full list of all conversations captured in your packet capture from Wireshark by going to Statistics –> Conversations.
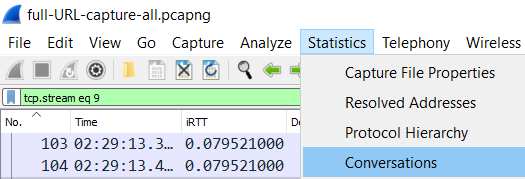
This will show a full list of all the captured conversations at each layer (Ethernet, IP, TCP). The TCP conversations are especially helpful.
Display and capture filter, drop-down previous filters: Whenever you’re using Wireshark, there are 2 types of filters, display filters are the ones you write in the top search bar, you can use these filters as we did above whenever you’re looking for packers that match specific criteria. You can mix and match these to be as granular as you want. Some filters I like to use include:
- Filter traffic by source, destination IP addresses or ports:
- ip.src==192.168.0.0/16 and ip.dst==192.168.0.0/16 # Using an and operator for a more specific condition
- ip.src== 8.8.8.8
- ip.addr == 10.0.0.1 # both source and destination traffic from this IP
- (ip.src == 10.0.0.2) and (sip)
- tcp.port == 443
- tcp.port == 80 or udp.port == 80 # Using an or operator to match more traffic/conditions
- tcp.port in {80..443} # Look for a range of ports
- ip.addr in {192.0.0.0..192.255.255.255} # Look for a range of IPs
When looking for TCP connectivity issues
- tcp.analysis.retransmission # Display all retransmitted packets, and combine this with the Follow TCP stream function to find the problematic conversation
- (frame.time >= “2022-11-29 12:34:00”) && (frame.time <= “2022-11-29 12:34:01”) && (tcp.flags.reset ==1) # Look for a reset packet in an specific timestamp
- tcp.analysis.flags #Filter bad TCP packets
Looking for specific flags:
- tcp.flags.syn == 1 # Look for packets with the SYN Flag on (either SYN or SYN/ACKs)
Looking for a specific protocol:
- tls
- dns
- http
More about these filters down below:
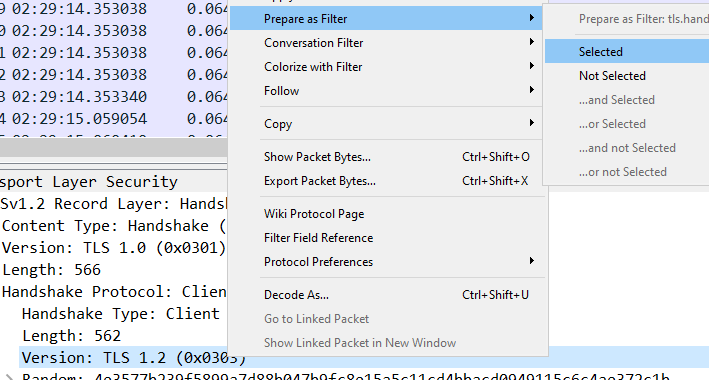
Another very useful thing that you can use is the “Prepare as a filter”, if you encounter a value that calls your attention, right-click it > Prepare as filter > and selected.
The other types of filters are what we call capture filters, these filters can be set before we start our Wireshark capture, this will limit and only capture the traffic that matches these criteria. You can set these in this initial type bar, keep in mind that capture filters use a different syntax than display filters.

More about capture filters here: CaptureFilters (wireshark.org)
Warning note: Capture filters are more simple and are set pre-capturing the packets, they should not be very specific since you can miss some important information. Ex: ip host 10.0.0.1 and port 80.
If you ever need to use a previously used filter, click the drop-down arrow in the top-left of the display filters bar, this will show all your previously used filters for this capture:

Matching simultaneous captures: Ideally, whenever you’re capturing traffic to troubleshoot a network issue, you will at least want to capture in both the source and destination systems simultaneously, this way you can correlate how the issue looks from both ends, for this you may use a few tricks, including:
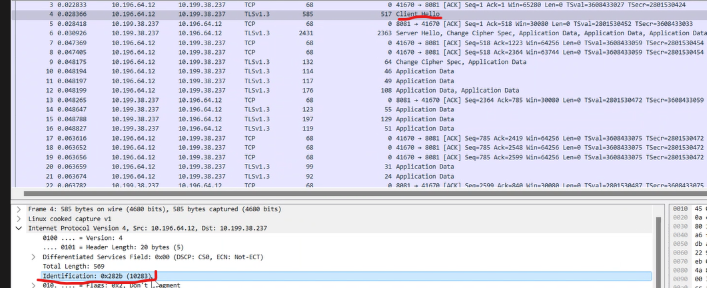
If you want to identify a conversation that went through NAT, check for the ID IP value, and use it with “prepare as filter”.
then if you find a packet that looks similar in both captures (Same destination port, similar timestamps) follow that packet with follow TCP stream (This may not work with proxy environments where a full new connection is being established).
That was quite a bit of Wireshark for a post 😅 Now, one thing I would like to cover is, what happens when we cannot install Wireshark and need to take a packet capture. This is a rather common scenario, in which, for instance, by security restrictions, you may not be able to install Wireshark on a database production server. Don’t worry my friend, we have a few options for those cases!
TCPDump, Netsh, and pktmon: These are the three hero tools that will come to our rescue whenever we need to take packet captures natively in almost any OS 🙂
TCPDump: Natively available in most Linux/Unix systems TCPDump is a simple and powerful tool that we can use to take packet captures:
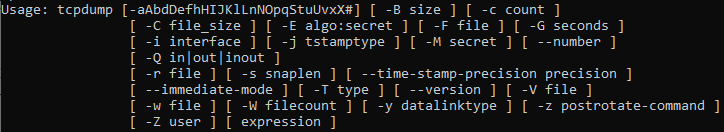
Most of the options are self-explicative but let’s give a short review:
-w # Writes the dump file with specific location/name

-s # Snaplen, the max number of byte size to capture per packet (use a short number like 128 or 256 if you're taking a big capture). -s 0 Setting snaplen to '0' means that you will use the required length to catch whole packets.

-v # Verbose, you can use up three v for more information, EX: -vvv

-i # Interface in which to capture traffic, Ex: -i eth0, combine with ip a or ifconfig to finds your NIC names

! port 22 # Great option to not capture SSH traffic (avoid noise)

# A full working example to start a capture:

sudo tcpdump -s 0 -vvv ! port 22 -w /tmp/testcapture.cap

# Use CTRL + C to stop your capture.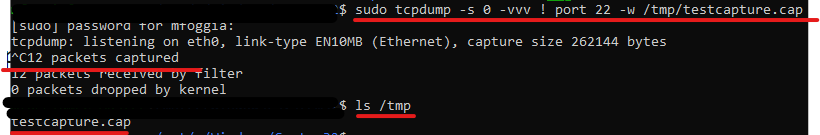
Bonus: If you need to export your capture from a Linux/Unix system that only has a CLI. Use an SFTP application such as WinSCP.
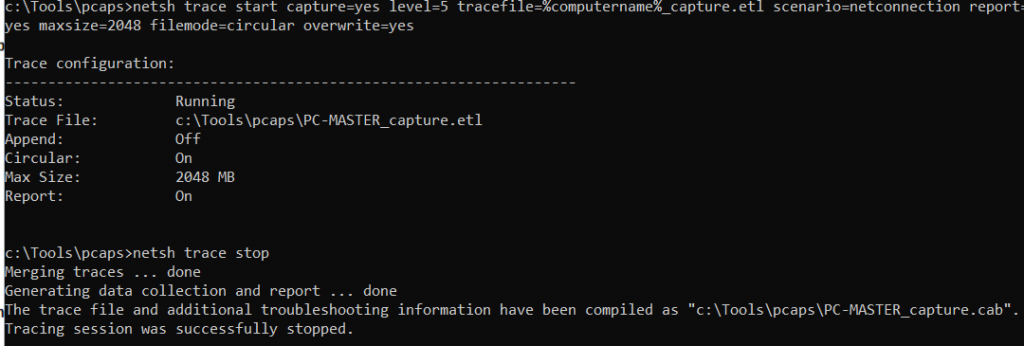
Netsh, and pktmon: What if we are using a Windows OS machine? Well, Netsh will come to our rescue! Natively available in all major Windows OS’es, you can take a capture at any time by using netsh, just open your command prompt as an administrator and run:
netsh trace start capture=yes level=5 tracefile=%computername%_capture.etl scenario=netconnection report=yes maxsize=2048 filemode=circular overwrite=yesThis will create a packet capture in our current folder, with the machine’s name and a max size of 2GB (You may increase this if required).
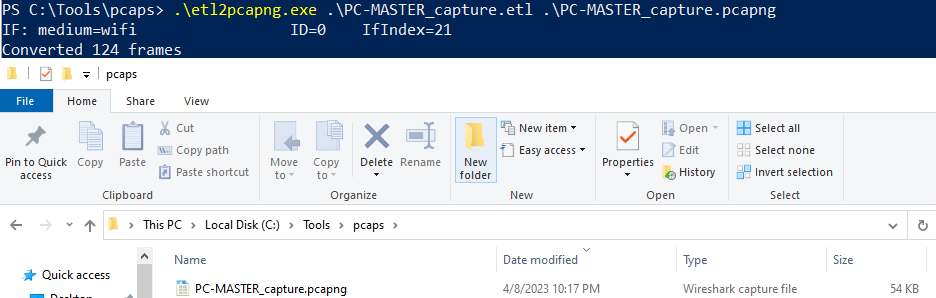
One thing worth mentioning is that the file will come in .ETL format, which by default we cannot open in Wireshark. There are a few solutions, but my favorite is a Microsoft open-source tool called ETL2PCAPNG. Once you have it installed, you can convert your ETL captures to PCAPNG with a simple command.
Did you say Pokemon? Ummm, not really but very close, if you’re using a newer Windows OS (WS2019, latest W10 versions, W11, etc.) pktmon is a newer alternative to NETSH to take packet captures, in the words of Microsoft “Packet Monitor (Pktmon) is an in-box, cross-component network diagnostics tool for Windows. It can be used for packet capture, packet drop detection, packet filtering, and counting. The tool is especially helpful in virtualization scenarios, like container networking and SDN, because it provides visibility within the networking stack.”.
A quick demo of how to use this:
pktmon filter add -t tcp -p 443 # Optional, check the help options for more filters
pktmon start --capture # Start capture
pktmon stop # Stop capture
pktmon pcapng PktMon.etl -o PktMonCapture.pcapng # Coverts your file to pcapng without donwloading ETL2PCAPNG!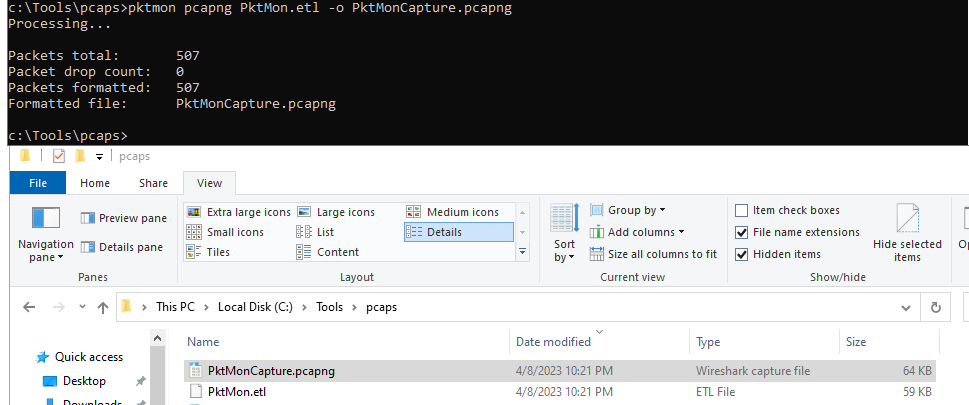
And that’s it for this post, it was a bit of a long one and there’s a LOT more we can talk about when it comes to packet analysis and using Wireshark, let me know if you would like me expanding on this topic, I am thinking about bringing some common or strange scenarios where Wireshark had helped me troubleshoot issues at the wire level. I hope you enjoyed, learned, and practiced!
I will see you next time for the second and following parts of this series where we will be talking about:
- Troubleshooting the application layer (Layer 7 – HTTP/HTTPS)
- CURL and OpenSSL
- Dev-tools and Fiddler
Thanks for reading! As always, wish you lots of success in your journey and hope to see you again here!