Hey there and welcome to the second part of this blog series! You may want to check out the first part here if you missed it. In this second part, we will be talking about:
So open your favorite command line utility or terminal and follow me while we explore some of these helpful tools for network troubleshooting!
Troubleshooting latency, performance, and throughput:
IPerf: IPerf is a fantastic tool I wish I’d discovered way earlier in my IT journey, in a few words, IPerf is a tool used for network performance and measuring, one of the most common scenarios where IPerf may come helpful, is whenever you want to calculate or measure the maximum throughput between two network devices. For instance, let’s imagine we have the following scenario:
You’re the network administrator at your company, is a peaceful and quiet morning in the network realm, when suddenly! Your company’s programmer comes right to your door (Or your team’s inbox!) and exclaims: “We need you to check the network right now, the data transferring for the new company’s application is way too slow, we need to get this fixed ASAP and get some more bandwidth!”. You jump right into the action, and since this is not your first rodeo, you know that applications and data transferring can be a bit more tricky than just the amount of bandwidth in your network, so you start asking a few questions:
- When did this issue start? It started this morning, this is our new software to transfer data to our partners at remote locations, we can’t afford this to be too slow.
- Where is the partner’s office? The partner’s office is in Australia East.
- How much data are you transferring? We are transferring about 50 MB of data for each job and we sent a LOT.
- How long is it taking to transfer? It takes around 45 – 60 seconds for each job.
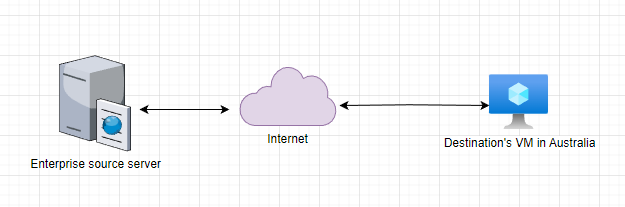
Ok, that is a good start, knowing this information you recommend installing and using IPerf to measure the throughput between the source (Office’s application server) and destination devices (Client’s remote computer).
So, let’s get IPerf into these two machines, we can do so from its official download page:
# For Windows:

# We need to get one of the versions and extract it to a known location, then we can use PowerShell or command prompt to access it, in my case I like to put it under C:\tools

PS C:\> cd C:\Tools\iperf-3.1.3-win64
PS C:\Tools\iperf-3.1.3-win64> dir


    Directory: C:\Tools\iperf-3.1.3-win64


Mode                 LastWriteTime         Length Name
----                 -------------         ------ ----
-a----         4/21/2016  10:14 PM        3539372 cygwin1.dll
-a----          6/9/2016  10:30 AM         468748 iperf3.exe


# For most of Linux, we can get it pretty easily depending of your distibution either with:


$sudo apt update
$sudo apt install iperf3

$sudo yum update
$sudo yum install iperf3
Once we got them installed on both devices, is time for testing:
#From our source server (Running Windows server) we will be running in client/sender mode with the following command:

.\iperf3.exe -c 20.53.244.167 -n 50MB -P 1

# In orange is the IP of the destination's machine
# -c is for client/connect mode -n is the amount of data we will transfer and -P is for parallel/multiple connections or multi-threads
# For this example we are transfering 50 MB of data with 1 thread

# In the destination machine (VM running Ubuntu) we will use server/receiver mode:
# Note: IPerf by default runs on port 5201, we can specify a different port with the -p option (ex: iperf3 -s -p 5000)

sudo iperf3 -s
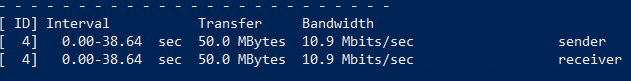
From this test we obtained the following results:
Total transfer time: 38.64 sec
Transfer: 50 MBytes
Bandwidth: 10.9 Mbits/sec
This seems to correlate to what we’ve been told by our development team, let’s run another test but this time with 32 parallel processes, simulating a multi-thread application:
# From our source application server we will run:

.\iperf3.exe -c 20.53.244.167 -n 50MB -P 32


# From destination, we will use the same command as before:

sudo iperf3 -s
And here we got the results for this test:
Total transfer time: 2.12 sec
Transfer: 50 MBytes
Bandwidth: 197 Mbits/sec

Well, that’s quite the difference! Almost x20 times faster than our first results, what changed? And what can we learn from these results? Initially:
- We can rule out the network as being the bottleneck for this transfer operation.
- We can determine that the transfer application is probably a single-threaded application.
- Given the right conditions, the devices could transfer this data at a much faster pace.
These results won’t directly fix our transfer issue, but they can help us identify where the real bottleneck is located if either at the network, client or application level.
Note: Even though we are getting “Bandwidth” results from IPerf, I prefer to consider these as throughput, check this article for an explanation of the difference. If we want to get a closer or more accurate measurement of available bandwidth, we can run IPerf for a bit longer like this:
.\iperf3.exe -c 20.53.244.167 -n 1000MB -P 96

# Sending 1 GB of data with 96 parallel connections.
Here we got some new results:
Total transfer time: 10.16 sec
Transfer: 1000 MBytes
Bandwidth: 826 Mbits/sec

This matches more closely to our office’s bandwidth of 1 Gbps.
NTTTCP:
This is another great tool to calculate throughput and troubleshoot performance, citing a Microsoft’s public document “When testing network throughput performance in Azure, it’s best to use a tool that targets the network for testing and minimizes the use of other resources that could impact performance. NTTTCP is recommended.”. This same document also goes on to show different examples depending on the source and destination OS’es we are using (Linux-to-Linux, Windows-Linux, Windows-Linux, Windows-to-Windows). Let’s jump right into the action and see an example of usage:# Command to send from our Windows source VM:
c:\Users\admin\Desktop>ntttcp.exe -s -m 32,*,20.53.244.167 -ns -t 30 -v
# Explaining some of these flags:
# "-s" is for sender
# "ns" is for no sync "Senders will start sending as soon as possible"
# "-t" is for the amount of time to run the test for
# "-v" is for verbose
# "-m" is for mappings, looking at the help session we got a good explanation for it:
# One or more mapping 3-tuples separated by spaces:
#(number of threads, processor number, receiver address or name)
Processor number must be in the process kgroup. If processor number
is "*", the threads are not affinitized.
e.g. "-m 4,0,1.2.3.4 2,*,contoso" sets up:
-4 threads on processor 0 to connect to 1.2.3.4
-2 unaffinitized threads to connect to contoso
# And from our Ubuntu destination
~$ sudo ntttcp -r -V -m 32,*From this test, we can see the following results:
Real time: 30 sec
Transfer: 3377.81 MBytes
Throughput: 112 MBytes/sec (896 Mbits/sec)
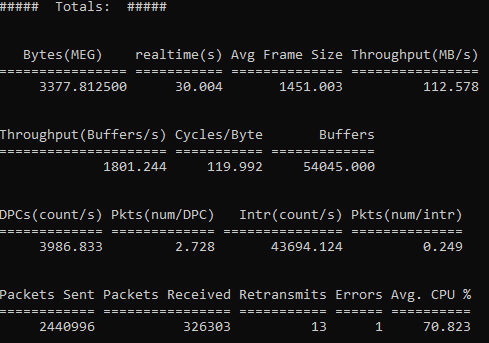
This matches really closely our previous test performed with IPerf and it gives us some great insights we can use for further analysis.
Now, what do we do if we want to test latency/jitter? You may think we can do a ping from source to destination.. Well, this may not be the best approach if we want to get the most accurate results, there are a few reasons for that, being the main reason that ping uses ICMP which could be treated differently than the application’s traffic, you can read a bit more about this here in this document. So what options do we have? Let’s take a look a two of them.
Latte:
In the words of its creators is “A Windows network latency benchmark tool.” Not a lot words, but more than enough for us to know and give a try! Let’s dive into it with an example between two Windows VMs in my Local Network (LAN).Note: We will need to allow latte through our Windows Host/ Firewall. For that we can use the following command:
# We will need to allow latte through our Windows Host/ Firewall. For that we can use the following command (Make sure to replace the <path> with your actual location, in my case c:\tools\latte.exe):
netsh advfirewall firewall add rule program=<path>\latte.exe name="Latte" protocol=any dir=in action=allow enable=yes profile=ANY
# Navigate to the your folder, where latte is located:
cd c:\tools\
# From our source/Sender VM we will be running:
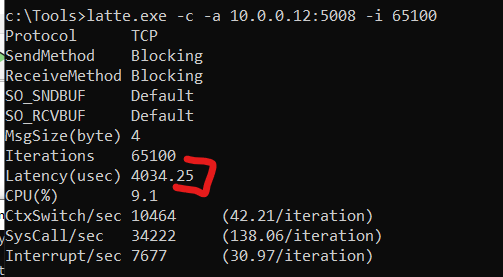
latte.exe -c -a 10.0.0.12:5008 -i 65100
# And from our destination VM:
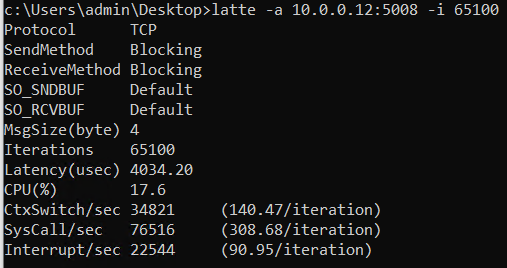
latte -a 10.0.0.12:5008 -i 65100
# Some of the meaning behind these flags include:
# "-c" For client / Sender
# "-a" is to specify the IP:Port for the connection
# "-i" is the number of iterations, in the cited article, Microsoft recommends at least 65100 to have more accurate resultsThat will run for a while and at the end, it should return similar results from both ends:
Latency (usec): 4034.25 (4.03 ms)
Sockperf:
Simirarily to latte, Sockperf is another good tool to test latency but from Linux VMs. You can find the installation instructions and read more about the project here. And let’s see a demonstration using our Australia VM and our local Linux VM. I will be using the following document as a guide for this example.Note: Even though I recommend going with the instructions above, I was able to quickly install the program in Ubuntu Linux using the following command: sudo apt install sockperf
# From our local source/sender VM we will run:
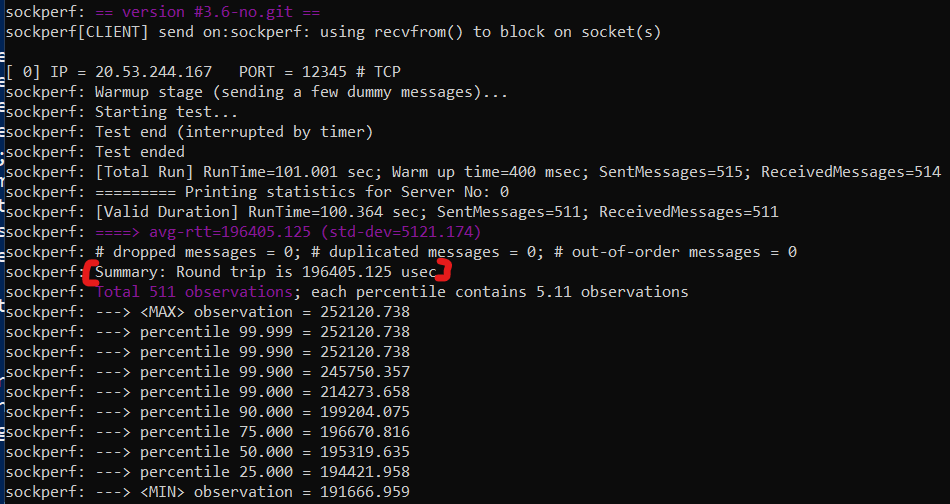
~$sudo sockperf ping-pong -i 20.53.244.167 --tcp -m 350 -t 101 -p 12345 --full-rtt
# From our destination we will use:
sudo sockperf sr --tcp -i 0.0.0.0 -p 12345
# Some of the used flags:
# "ping-pong (pp)" Run sockperf client for latency test in ping pong mode
# "sr" Is to run as a server
# "i" Listen or Send to IP <IP>
# "p" for port number (Default uses UDP)
# "--tcp" Use TCP instead of UDP
# "-m" Set maximum message size that the server can receive <size> bytes (default 65507)
# "-t" Time of running the test in seconds
Results from Sockperf:
RTT: 196405 usec (196 ms).
Well, we have come to the end of this second part of network tools and utilities. Thanks so much for reading and visiting my blog! I hope you enjoyed and learned at least something new today, remember always keep learning, stay curious, and put yourself to practice everything! As with practice comes mastery.
I will see you next time for the second and following parts of this series where we will be talking about:
- Troubleshooting DNS
- NSLookup and DIG
- Packet analysis
- Wireshark and TCPDump
- Troubleshooting the application layer (Layer 7 – HTTP/HTTPS)
- CURL and OpenSSL
- Dev-tools and Fiddler
I will see you next time 🙂