Network tools, we all loved them right? “A man is only as good as his tools” This is a phrase you’ve probably heard in the past, maybe your friend told this to you while trying to hammer a nail using a flat screwdriver, or was that a weird commercial? Anyway, a good tool in the appropriate moment can save you an immense amount of time and can make you much more efficient while performing the task at hand, this is true in all areas of life and computer networking is no different. Today we will be looking at some of the most known and not-so-well network tools and utilities and how you can use them to make your network troubleshooting and analysis more efficient.
When we talk about network tools we will find ourselves in a vast and deep ocean of options, from open to close source tools, integrated with OS, externally hosted, and much more. I will try to keep an order of some of the tools, some of their usages, use cases, and examples. Consider this a non-exhaustive list to which I may add more points as time passes 🙂
Command Line Utilities
Troubleshooting connectivity (TCP/IP):
Ping
: Ping is a great tool we all love and know, is simple and efficient, it works at the layer 3 (Network layer) by using the ICMP protocol. It sends ICMP requests from a source device to a destination IP. Lets expand into that a bit more, what does it means to operate at layer 3? So if we take a look at the OSI model: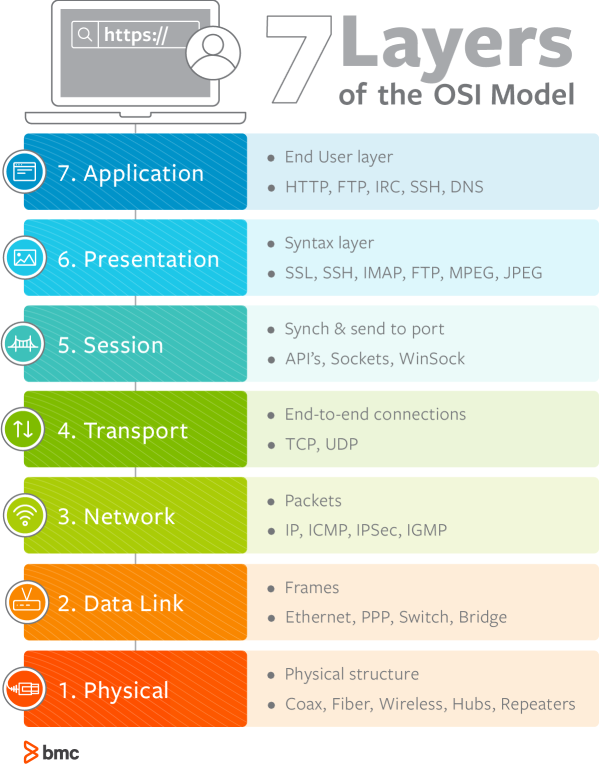
When we talk about the network layer we usually refer to IP addressing and packets. ICMP is a protocol that verifies and confirms connectivity up to layer 3 or up to the IP address communication. ICMP is not TCP nor UDP, hence it doesn’t use a source or destination ports.
Ping is a great tool to verify if the first three layers of the OSI model are up and working correctly. A great thing about ping is that it is universally available on virtually any network device. Let’s see a demonstration of ping in action:
PS C:\tools> ping 8.8.8.8

Pinging 8.8.8.8 with 32 bytes of data:
Reply from 8.8.8.8: bytes=32 time=11ms TTL=113
Reply from 8.8.8.8: bytes=32 time=10ms TTL=113
Reply from 8.8.8.8: bytes=32 time=9ms TTL=113
Reply from 8.8.8.8: bytes=32 time=9ms TTL=113

Ping statistics for 8.8.8.8:
    Packets: Sent = 4, Received = 4, Lost = 0 (0% loss),
Approximate round trip times in milli-seconds:
    Minimum = 9ms, Maximum = 11ms, Average = 9ms
Alright, so we got a few things to touch on here, in this test, we are pinging 8.8.8.8 or one of dns.google.com IP addresses. By default ping in windows sends 4 ICMP request packets to the destination IP or FQDN that we choose. It gives us some great insights when troubleshooting connectivity, these are:
- The latency or time between our source and the destination: 9-11 milliseconds (ms).
- The Time To Live (TTL) value: 113.
- The amount of loss based on the number of replies received: 0%
Essentially it is telling us we can reach our destination, so we can mostly rule out routing and network connectivity to the destination (There’s a catch to it, you got it is the other 4 layers, we will get to that soon!).
For the sake of it here is a failed example of using ping :
PS C:\tools> ping azure.com

Pinging azure.com [20.37.196.198] with 32 bytes of data:
Request timed out.
Request timed out.
Request timed out.
Request timed out.

Ping statistics for 20.37.196.198:
    Packets: Sent = 4, Received = 0, Lost = 4 (100% loss),
And here are some of the options I commonly use:
ping -t 8.8.8.8   # This is a continuous ping or ping to death :D, stop it by pressing CTRL + C

ping -n 10 8.8.8.8   # Sends a specify number of ping packets

ping -i 3 8.8.8.8    # Sends ping with a custom TTL, 3 in this example

ping -4 8.8.8.8      # Forces ping to use IPv4 only

ping -f -l 1600 8.8.8.8     # Set don't fragment flag and change MTU size to 1600

ping /?    # Check all other available options in Windows

ping --help   # Check all available options in Linux
Traceroute (Linux/Unix) or tracert (Windows):
is another great networking tool that shows all the hops or devices between a source and a destination. Traceroute also uses the ICMP protocol, it takes advantage of the TTL value, sending a ICMP echo request with a low TTL value starting from 1 and gradually increasing so it detects the devices between our source and destination, it is very useful when we want to verify what routing path a device is taking to reach its destination, it can also be helpful to diagnostic packet loss or measure what hop in the path could be adding latency to our packets. Lets see it in action:# Tracert result in Windows to 8.8.8.8
PS C:\Users\admin> tracert 8.8.8.8
Tracing route to dns.google [8.8.8.8]
over a maximum of 30 hops:
1 * * * Request timed out.
2 * * * Request timed out.
3 * * * Request timed out.
4 * * * Request timed out.
5 * * * Request timed out.
6 * * * Request timed out.
7 1 ms 2 ms 2 ms ae28-0.ier01.chi30.ntwk.msn.net [104.44.235.37]
8 3 ms 3 ms 3 ms ae61-0.ier01.chi30.ntwk.msn.net [104.44.45.118]
9 1 ms 1 ms 1 ms 142.251.64.201
10 1 ms 1 ms 2 ms 142.251.60.207
11 2 ms 1 ms 1 ms dns.google [8.8.8.8]
In this example, we can see all the routers between our source computer (a VM in Azure) and dns.gooogle, there is a total of 10 hops or devices before we get to our destination. It is very probable that you will see some hops as (* * *) similar to the examples above, this usually means that there is still a hop or router in that location but it doesn’t respond to ICMP traffic. This is usually done for security purposes to prevent Denial of service (DDoS) attacks.
Pathping: Is a similar utility to traceroute, it actually uses tracert and ping, the main difference is that pathping sends multiple pings to each hop between your source and destination, one of the reasons you could use pathping is to determine packet loss in any of the hops. This is better explained by an example:
PS C:\> pathping -n 8.8.8.8

Tracing route to 8.8.8.8 over a maximum of 30 hops

  0  10.0.0.116
  1  10.0.0.10
  2  10.0.0.1
  3  Redacted
  4  Redacted
  5  Redacted
  6  Redacted
  7  Redacted
  8  Redacted
  9  Redacted
 10  142.250.47.82
 11  108.170.240.193
 12  142.251.60.137
 13  8.8.8.8

Computing statistics for 325 seconds...
            Source to Here   This Node/Link
Hop  RTT    Lost/Sent = Pct  Lost/Sent = Pct  Address
  0                                           10.0.0.116
                                0/ 100 =  0%   |
  1    5ms     0/ 100 =  0%     0/ 100 =  0%  10.0.0.10
                                0/ 100 =  0%   |
  2    3ms     0/ 100 =  0%     0/ 100 =  0%  10.0.0.1
                                0/ 100 =  0%   |
  3    6ms     0/ 100 =  0%     0/ 100 =  0%  Redacted
                                0/ 100 =  0%   |
  4    5ms     0/ 100 =  0%     0/ 100 =  0%  Redacted
                                0/ 100 =  0%   |
  5    6ms     0/ 100 =  0%     0/ 100 =  0%  Redacted
                                0/ 100 =  0%   |
  6    6ms     0/ 100 =  0%     0/ 100 =  0%  Redacted
                                0/ 100 =  0%   |
  7    8ms     0/ 100 =  0%     0/ 100 =  0%  Redacted
                                0/ 100 =  0%   |
  8    9ms     0/ 100 =  0%     0/ 100 =  0%  Redacted
                                0/ 100 =  0%   |
  9    6ms     0/ 100 =  0%     0/ 100 =  0%  Redacted
                                0/ 100 =  0%   |
 10   15ms     0/ 100 =  0%     0/ 100 =  0%  142.250.47.82
                                0/ 100 =  0%   |
 11   11ms     0/ 100 =  0%     0/ 100 =  0%  108.170.240.193
                                0/ 100 =  0%   |
 12  ---     100/ 100 =100%   100/ 100 =100%  142.251.60.137
                                0/ 100 =  0%   |
 13   10ms     0/ 100 =  0%     0/ 100 =  0%  8.8.8.8

Trace complete.
In the above example, we can see there is no packet loss provided by the pathping report except in hop 12, which is 100%, rather than packet loss indicates that this device is most likely using a traffic limiter mechanism and is not responding to our pings sent by pathping.
MTR: This is one of my favorite tracing tools, natively available in various Linux distributions or if not easily installable, MTR is very similar to traceroute but provides some extra functions that can come very handy. If you run mtr 8.8.8.8 in your terminal, MTR will open a real-time session where it sends pings to every device between your source and destination and updates the metrics in each run.
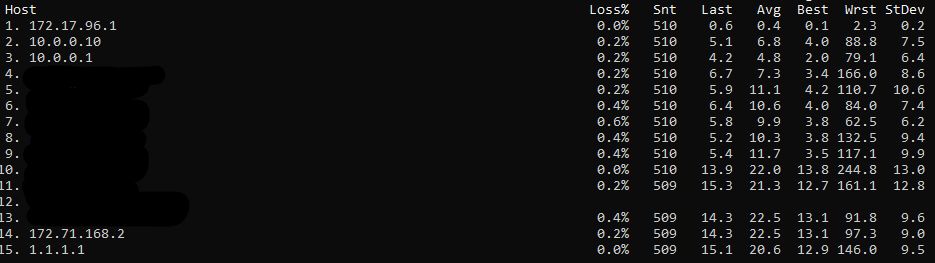
One of the options I like to use with MTR is its report feature, which will do 1 round of pings by specifying how many report-cycles you would like and then will print the results on screen in a nice report format.
$mtr --report --report-cycles 30 --no-dns 8.8.8.8
Start: 2023-01-31T20:22:30-0600
HOST: PC05                   Loss%   Snt   Last   Avg  Best  Wrst StDev
  1.|-- 172.17.96.1                0.0%    30    0.5   0.6   0.2   0.9   0.2
  2.|-- 10.0.0.10                  0.0%    30    4.2   5.6   4.2  13.3   1.7
  3.|-- 10.0.0.1                   0.0%    30    4.9   3.7   2.4   6.1   1.1
  4.|-- Redacted                   0.0%    30    5.5   8.4   3.7  40.4   7.3
  5.|-- Redacted                   0.0%    30    7.9  10.8   5.3  65.2  10.9
  6.|-- Redacted                   0.0%    30    9.7   7.9   5.4  19.4   2.9
  7.|-- Redacted                   0.0%    30    6.7   8.8   5.4  35.5   5.8
  8.|-- Redacted                   0.0%    30    7.1   7.0   5.2  17.1   2.4
  9.|-- Redacted                   0.0%    30    5.9   7.4   5.3  16.0   2.1
 10.|-- Redacted                   0.0%    30   16.9   8.3   6.2  16.9   2.2
 11.|-- Redacted                   0.0%    30    8.3  12.4   8.2  27.9   4.8
 12.|-- Redacted                   0.0%    30   10.1  12.3   9.5  54.0   7.9
 13.|-- Redacted                   0.0%    30    9.2  11.7   9.2  32.1   4.1
 14.|-- 8.8.8.8                    0.0%    30   10.5  10.8   9.0  20.0   2.1
Alright, so until now all the tools that we’ve explored use the ICMP protocol, which is a really nice option when is available, but as mentioned, this is not always the case in real-life networks, many times we will find that ICMP is either block at the OS or network firewall levels. So what do we do when we want to confirm if a device is reachable if it doesn’t respond to our pings? Well, my friend that’s where the following list of tools will come in very handy:
PSPing:
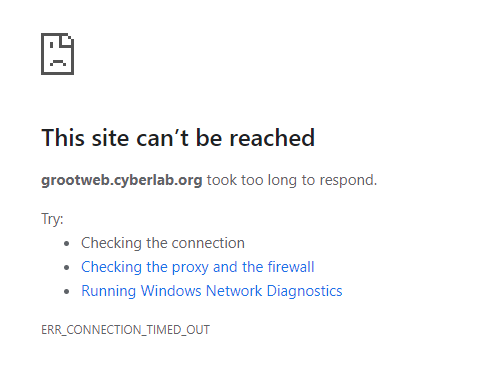
A tool written by Microsoft, as the names indicates it works like ping but instead of pinging a device with ICMP, we will be “pinging” a TCP port, and see if this is open, up and running or not. This is a third-party tool which means, we will need to download it and extract it first. Once you extract the zip, navigate to the PSTools from your favorite CLI. (Ex: cd c:\Users\your_user_name\downloads\PSTools) and lets see an example of how we will use it:Imagine that you have a web server that you want to check if it is accessible from your current location, doing a ping doesn’t return a response:
PS C:\> ping grootweb.cyberlab.org

Pinging grootweb.cyberlab.org [10.0.2.20] with 32 bytes of data:
Request timed out.
Request timed out.

Ping statistics for 10.0.2.20:
    Packets: Sent = 2, Received = 0, Lost = 2 (100% loss),
Control-C


# Now lets use psping to check if port 443 or HTTPS is open.


PS C:\> psping.exe grootweb.cyberlab.org:443

PsPing v2.10 - PsPing - ping, latency, bandwidth measurement utility
Copyright (C) 2012-2016 Mark Russinovich
Sysinternals - www.sysinternals.com

TCP connect to 10.0.2.20:443:
5 iterations (warmup 1) ping test:
Connecting to 10.0.2.20:443 (warmup): from 10.0.0.116:2152: 4.63ms
Connecting to 10.0.2.20:443: from 10.0.0.116:2153: 7.77ms
Connecting to 10.0.2.20:443: from 10.0.0.116:2154: 5.04ms
Connecting to 10.0.2.20:443: from 10.0.0.116:2155: 4.82ms
Connecting to 10.0.2.20:443: from 10.0.0.116:2156: 7.61ms

TCP connect statistics for 10.0.2.20:443:
  Sent = 4, Received = 4, Lost = 0 (0% loss),
  Minimum = 4.82ms, Maximum = 7.77ms, Average = 6.31ms
Look at that! We got some nice responses back from our web server! This is a great tool to test reachability to a destination on any TCP port, some common examples could be testing TCP ports 22 (SSH), 80 (HTTP), 443 (HTTPS), and 3389 (RDP). But really just about any port, you may need to test out.
Quick note: You can use most of the options from ping with psping, for example, use the -t to do a continuous psping:
psping.exe -t 10.0.0.25:443
TNC: Or Test-NetConnection, similar to psping, TNC allows us to check if we can establish a TCP connection to a specific port, one of the advantages of TNC is that we can use it natively from Windows PowerShell. So you ahead, open a PowerShell and tryout TNC as follows:
PS C:\> tnc google.com -port 443


ComputerName     : google.com
RemoteAddress    : 142.251.32.142
RemotePort       : 443
InterfaceAlias   : Wi-Fi
SourceAddress    : 10.0.0.116
TcpTestSucceeded : True


# And a non-working example:

PS C:\> tnc google.com -port 3389
WARNING: TCP connect to (142.251.32.142 : 3389) failed


ComputerName           : google.com
RemoteAddress          : 142.251.32.142
RemotePort             : 3389
InterfaceAlias         : Wi-Fi
SourceAddress          : 10.0.0.116
PingSucceeded          : True
PingReplyDetails (RTT) : 11 ms
TcpTestSucceeded       : False
Now, these two tools are nice if we are using Windows, but what options do we have for Linux?
Telnet: Telnet is a classic network protocol, previously used to remotely manage network devices and superseded by a more secure and encrypted protocol SSH, telnet still has some utilities nowadays, we can use telnet to check if a port is open, just like this:
# So first a non-working example, trying to connect to our server in port 5060 (VoIP) stays on trying and will eventually timeout.

mfoggia@PC-Master:/mnt/c/Windows/System32$ telnet 10.0.2.20 5060
Trying 10.0.2.20...

# Conversely, connecting to port 80 (HTTP) gives us a "connected" response, sometimes we just may get a blank black screen, this also means the connection succeeded.

user@PC:/mnt/c/Windows/System32$ telnet 10.0.2.20 80
Trying 10.0.2.20...
Connected to 10.0.2.20.
Escape character is '^]'.
^C
Connection closed by foreign host.
NPing: Part of the NMAP suite, nping allows us to perform a TCP ping like PSPing on Windows but from our favorite Linux distro. We may need to install it first:
$sudo apt install nmap

# Now lets try it out

$sudo nping --tcp-connect -p 443 google.com


Starting Nping 0.7.80 ( https://nmap.org/nping ) at 2023-02-03 22:58 CST
SENT (0.0205s) Starting TCP Handshake > google.com:443 (142.251.32.142:443)
RCVD (0.0312s) Handshake with google.com:443 (142.251.32.142:443) completed
SENT (1.0239s) Starting TCP Handshake > google.com:443 (142.251.32.142:443)
RCVD (1.0389s) Handshake with google.com:443 (142.251.32.142:443) completed
SENT (2.0280s) Starting TCP Handshake > google.com:443 (142.251.32.142:443)
RCVD (2.0418s) Handshake with google.com:443 (142.251.32.142:443) completed
SENT (3.0316s) Starting TCP Handshake > google.com:443 (142.251.32.142:443)
RCVD (3.0451s) Handshake with google.com:443 (142.251.32.142:443) completed
SENT (4.0350s) Starting TCP Handshake > google.com:443 (142.251.32.142:443)
RCVD (4.0514s) Handshake with google.com:443 (142.251.32.142:443) completed

Max rtt: 16.477ms | Min rtt: 10.313ms | Avg rtt: 13.853ms
TCP connection attempts: 5 | Successful connections: 5 | Failed: 0 (0.00%)
Nping done: 1 IP address pinged in 4.05 seconds
Now let’s say that from our previous example, we tried to psping our web server and we didn’t get a response, how can we check if the web server application is actually running? What options do we have to ensure that the ports running these applications are listening to requests? Well my friend that’s where Netstat will come to our rescue.
Netstat:
Netstat or network statistics is a network utility that we can use in most operating systems, its functions include: Print network connections, routing tables, interface statistics, masquerade connections, and multicast memberships. Now one of its most useful utilities is its ability to print the network connections and list the ports and states when we run it in our local machine. Going back to our example, we tried to run a psping to our web server but it is not responding:PS C:\> psping grootweb.cyberlab.org:443
PsPing v2.10 - PsPing - ping, latency, bandwidth measurement utility
Copyright (C) 2012-2016 Mark Russinovich
Sysinternals - www.sysinternals.com
TCP connect to 10.0.2.20:443:
5 iterations (warmup 1) ping test:
Connecting to 10.0.2.20:443 (warmup): from 0.0.0.0:13166:
This operation returned because the timeout period expired.
Connecting to 10.0.2.20:443: from 0.0.0.0:13168:
This operation returned because the timeout period expired.
Connecting to 10.0.2.20:443: from 0.0.0.0:13170:
This operation returned because the timeout period expired.
Connecting to 10.0.2.20:443:
Sent = 2, Received = 0, Lost = 2 (100% loss),
Minimum = 0.00ms, Maximum = 0.00ms, Average = 0.00ms
Control-CWe’ve also tried to access its webpage but no luck…
Let’s say we have remote access to this server, so we RDP/SSH into it and start troubleshooting what could be going on! Alright, we are in, the web server seems to be a Windows Server probably running IIS. Let’s open a command prompt and run netstat to check the listening ports:
C:\Users\Administrator>netstat -ano

Active Connections

  Proto  Local Address          Foreign Address        State           PID
  TCP    0.0.0.0:135            0.0.0.0:0              LISTENING       772
  TCP    0.0.0.0:445            0.0.0.0:0              LISTENING       4
  TCP    0.0.0.0:3389           0.0.0.0:0              LISTENING       1008
  TCP    0.0.0.0:5357           0.0.0.0:0              LISTENING       4
  TCP    0.0.0.0:5985           0.0.0.0:0              LISTENING       4
  TCP    0.0.0.0:47001          0.0.0.0:0              LISTENING       4
  TCP    0.0.0.0:49664          0.0.0.0:0              LISTENING       476
  TCP    0.0.0.0:49665          0.0.0.0:0              LISTENING       1184
  TCP    0.0.0.0:49666          0.0.0.0:0              LISTENING       1720
  TCP    0.0.0.0:49667          0.0.0.0:0              LISTENING       1116
  TCP    0.0.0.0:49668          0.0.0.0:0              LISTENING       604
  TCP    0.0.0.0:49669          0.0.0.0:0              LISTENING       3020
  TCP    0.0.0.0:49673          0.0.0.0:0              LISTENING       588
  TCP    0.0.0.0:63801          0.0.0.0:0              LISTENING       3432


# Output shortened for brevity
That’s quite a bit of text! So, what do we focus on here? There are a few things we can highlight, our first column indicates the protocol (TCP, UDP, ICMP, etc.) The second column is the local address and the port separated by a colon (:) that is listening for new connections. (0.0.0.0) is not the local address of the machine but rather a way of netstat to tell us that ALL IPv4 addresses on this machine will be listening for the mentioned port. In the State column, here we will have what is the current state of the connection, in this case, the listening state indicates the port is open is listening for new connections, and that we have a service running on this port. Finally, the PID (Process ID) is used in Windows to identify the application or service running behind this port.
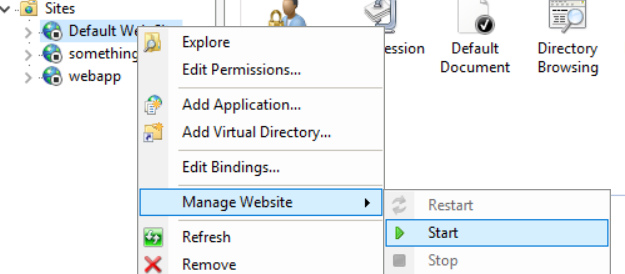
Ok, so now we that what we are looking at, but do you see something wrong? Ummmm well yeah, the HTTP (80) and HTTPS (443) ports are not listed on a listening state.. Ummm why that may be? Let’s check the IIS manager. Oh! The websites are stopped, that would explain it!

Let’s start them back and test netstat again:
C:\Users\Administrator>netstat -ano

Active Connections

  Proto  Local Address          Foreign Address        State           PID
  TCP    0.0.0.0:80             0.0.0.0:0              LISTENING       4
  TCP    0.0.0.0:135            0.0.0.0:0              LISTENING       772
  TCP    0.0.0.0:443            0.0.0.0:0              LISTENING       4
  TCP    0.0.0.0:445            0.0.0.0:0              LISTENING       4
  TCP    0.0.0.0:3389           0.0.0.0:0              LISTENING       1008
  TCP    0.0.0.0:5357           0.0.0.0:0              LISTENING       4
  TCP    0.0.0.0:5985           0.0.0.0:0              LISTENING       4
  TCP    0.0.0.0:47001          0.0.0.0:0              LISTENING       4
  TCP    0.0.0.0:49664          0.0.0.0:0              LISTENING       476
  TCP    0.0.0.0:49665          0.0.0.0:0              LISTENING       1184
  TCP    0.0.0.0:49666          0.0.0.0:0              LISTENING       1720
  TCP    0.0.0.0:49667          0.0.0.0:0              LISTENING       1116
  TCP    0.0.0.0:49668          0.0.0.0:0              LISTENING       604
  TCP    0.0.0.0:49669          0.0.0.0:0              LISTENING       3020
  TCP    0.0.0.0:49673          0.0.0.0:0              LISTENING       588
  TCP    0.0.0.0:63801          0.0.0.0:0              LISTENING       3432


# That's better! Lets try running a psping to it:

PS C:\> psping grootweb.cyberlab.org:443

PsPing v2.10 - PsPing - ping, latency, bandwidth measurement utility
Copyright (C) 2012-2016 Mark Russinovich
Sysinternals - www.sysinternals.com

TCP connect to 10.0.2.20:443:
5 iterations (warmup 1) ping test:
Connecting to 10.0.2.20:443 (warmup): from 10.0.0.116:13609: 8.00ms
Connecting to 10.0.2.20:443: from 10.0.0.116:13610: 7.75ms
Connecting to 10.0.2.20:443: from 10.0.0.116:13612: 4.49ms
Connecting to 10.0.2.20:443: from 10.0.0.116:13613: 20.45ms
Connecting to 10.0.2.20:443: from 10.0.0.116:13614: 13.16ms

TCP connect statistics for 10.0.2.20:443:
  Sent = 4, Received = 4, Lost = 0 (0% loss),
  Minimum = 4.49ms, Maximum = 20.45ms, Average = 11.46ms
Awesome! We can establish a TCP connection to the HTTPS port! Can we access the website now?

Sweet! We got our page back, thanks netstat!
SS (Socket statistics): This is a newer alternative to netstat but for Linux distributions, sometimes if netstat is not available by default in your Linux system, there’s a big possibility that SS is. It works pretty much the same way as netstat:
$ ss -ano
Netid State Recv-Q Send-Q Local Address:Port Peer Address:Port Process
nl UNCONN 0 0 0:0 *
nl UNCONN 768 0 4:0 *
nl UNCONN 4352 0 4:1244 *
nl UNCONN 0 0 6:0 *
nl UNCONN 0 0 10:0 *
nl UNCONN 0 0 11:0 *
nl UNCONN 0 0 12:0 *
nl UNCONN 0 0 15:0 *
nl UNCONN 0 0 16:0 *
u_seq LISTEN 0 4096 /run/WSL/166_interop 1055 * 0
u_seq LISTEN 0 4096 /run/WSL/1154_interop 30301 * 0
u_seq LISTEN 0 4096 /run/WSL/1228_interop 30332 * 0
tcp LISTEN 0 1 0.0.0.0:80 0.0.0.0:*
tcp LISTEN 0 1 0.0.0.0:443 0.0.0.0:*


# Some good options that you have with this command are:

ss -l      # Display all listening connections

ss -t -a   # Display all TCP Connections.

ss -4 state listening   # Display all IPv4 connections with listening state, you can change the state to any other you may be looking for.

ss dst 10.0.0.60         # This is useful if you're looking to check if a device with an specific IP has established a connection to your server. Results example:

$ ss dst 10.0.0.60
Netid  State  Recv-Q  Send-Q    Local Address:Port    Peer Address:Port Process
tcp    ESTAB  0       0        172.17.111.182:32768      10.0.0.60:ssh
NCAT and NMAP:
We can’t finish this first part of network troubleshooting tools without talking about NMAP and NCAT, many of you are probably familiar with these two tools and I could go on explaining the many usages (A LOT) that may perform with these tools. However, at this time I would just like to mention them and show a few demonstrations on how I find myself using them:NCAT: In the words of its creators:
“Ncat is a feature-packed networking utility which reads and
writes data across networks from the command line. Ncat was
written for the Nmap Project and is the culmination of the
currently splintered family of Netcat incarnations. It is
designed to be a reliable back-end tool to instantly provide
network connectivity to other applications and users. Ncat will
not only work with IPv4 and IPv6 but provides the user with a
virtually limitless number of potential uses.”
Some of its usages include making a listening port, let’s say you have a Linux box laying around and you would like to temporarily create a listening port for a lab or Proof-of-Concept (PoC). We can use this very easily with NCAT as follows:
#Make listening ports:
nc -lk 0.0.0.0 5060 -vvv (TCP) # -v option for verbose and -k option to "keep-listening"

nc -l -u 0.0.0.0 5060 (UDP)

#Connect to listening port
nc 10.0.0.0 5060 (TCP)
nc -vz -u 10.0.0.0 5060 (UDP)


# One working example:

# Listening server:

pi@raspberrypi:~ $ nc -lk 0.0.0.0 5065 -vvv
Listening on [0.0.0.0] (family 2, port 5065)


# Connecting client

$ nc 10.0.0.60 5065 -v
Connection to 10.0.0.60 5065 port [tcp/*] succeeded!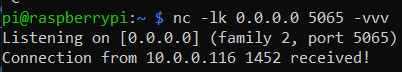
NMAP: This is a beast on its own, its uses are many and I may write more articles just to expand more on this topic. For now, let’s read its introductory description:
“Nmap (“Network Mapper”) is an open source tool for network exploration and security auditing. It was designed to rapidly scan large networks, although it works fine against single hosts. Nmap uses raw IP packets in novel ways to determine what hosts are available on the network, what services (application name and version) those hosts are offering, what operating systems (and OS versions) they are running, what type of packet filters/firewalls are in use, and dozens of other characteristics. While Nmap is commonly used for security audits, many systems and network administrators find it useful for routine tasks such as network inventory, managing service upgrade schedules, and monitoring host or service uptime.” (NMAP Project).
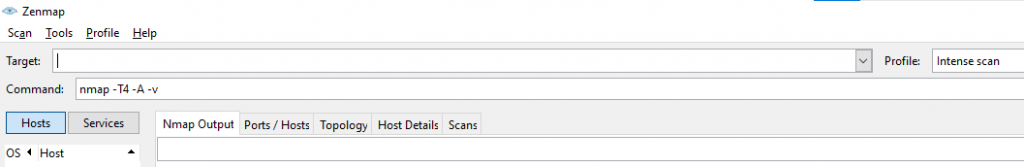
NMAP is also a 3rd-party utility which means we will need to install it on our systems, for that take a look at the page above and follow the download instructions. NMAP for Windows also includes the Zenmap GUI utility, this is a great tool to get familiar with NMAP and its options:
Quick note: Before using NMAP consider it is a network port scanner, don’t run it against hosts or devices to which you’re not authorized to test or access.
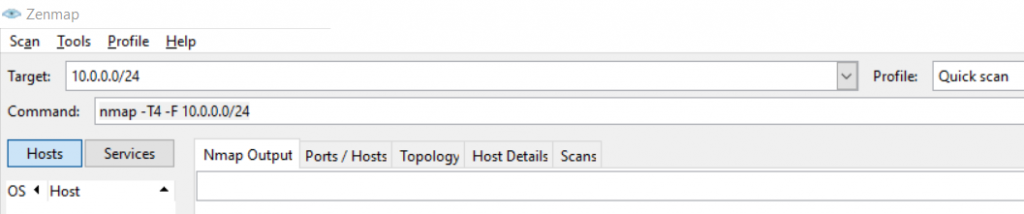
So, what are some good options we have with NMAP? Well, it depends, what is it that you want to do? Some good usages include scanning all the devices within your local network for initial assessments, we could run a quick scan like this:
nmap -T4 -F 10.0.0.0/24Or if you prefer the zenmap app:
We could run an intense or full scan against a host in our network to identify all the TCP ports open on it:
nmap -p 1-65535 -T4 -A -v 10.0.2.20 # this may take some time to run
We could check if a device is up, even though it may be blocking our regular scans and pings:
Nmap -Pn 10.0.0.1 # -Pn Treat all hosts as online -- skip host discoveryAnd a whole lot more, also consider that NMAP is not just a simple port scanner, it can also do things such as detect the OS and version of the scanned device, draw a simple network topology, perform IDS/IPS evasion and spoofing, etc., etc. For the sake of demonstration here are a few other options we may use provided by the help page of NMAP itself:
PS C:\> nmap --help
Nmap 7.92 ( https://nmap.org )
Usage: nmap [Scan Type(s)] [Options] {target specification}
TARGET SPECIFICATION:
  Can pass hostnames, IP addresses, networks, etc.
  Ex: scanme.nmap.org, microsoft.com/24, 192.168.0.1; 10.0.0-255.1-254
  -iL <inputfilename>: Input from list of hosts/networks
  -iR <num hosts>: Choose random targets
  --exclude <host1[,host2][,host3],...>: Exclude hosts/networks
  --excludefile <exclude_file>: Exclude list from file
HOST DISCOVERY:
  -sL: List Scan - simply list targets to scan
  -sn: Ping Scan - disable port scan
  -Pn: Treat all hosts as online -- skip host discovery
  -PS/PA/PU/PY[portlist]: TCP SYN/ACK, UDP or SCTP discovery to given ports
  -PE/PP/PM: ICMP echo, timestamp, and netmask request discovery probes
  -PO[protocol list]: IP Protocol Ping
  -n/-R: Never do DNS resolution/Always resolve [default: sometimes]
  --dns-servers <serv1[,serv2],...>: Specify custom DNS servers
  --system-dns: Use OS's DNS resolver
  --traceroute: Trace hop path to each host
SCAN TECHNIQUES:
  -sS/sT/sA/sW/sM: TCP SYN/Connect()/ACK/Window/Maimon scans
  -sU: UDP Scan
  -sN/sF/sX: TCP Null, FIN, and Xmas scans
  --scanflags <flags>: Customize TCP scan flags
  -sI <zombie host[:probeport]>: Idle scan
  -sY/sZ: SCTP INIT/COOKIE-ECHO scans
  -sO: IP protocol scan
  -b <FTP relay host>: FTP bounce scan
PORT SPECIFICATION AND SCAN ORDER:
  -p <port ranges>: Only scan specified ports
    Ex: -p22; -p1-65535; -p U:53,111,137,T:21-25,80,139,8080,S:9
  --exclude-ports <port ranges>: Exclude the specified ports from scanning
  -F: Fast mode - Scan fewer ports than the default scan
  -r: Scan ports consecutively - don't randomize
  --top-ports <number>: Scan <number> most common ports
  --port-ratio <ratio>: Scan ports more common than <ratio>
SERVICE/VERSION DETECTION:
  -sV: Probe open ports to determine service/version info
  --version-intensity <level>: Set from 0 (light) to 9 (try all probes)
  --version-light: Limit to most likely probes (intensity 2)
  --version-all: Try every single probe (intensity 9)
  --version-trace: Show detailed version scan activity (for debugging)
SCRIPT SCAN:
  -sC: equivalent to --script=default
  --script=<Lua scripts>: <Lua scripts> is a comma separated list of
           directories, script-files or script-categories
  --script-args=<n1=v1,[n2=v2,...]>: provide arguments to scripts
  --script-args-file=filename: provide NSE script args in a file
  --script-trace: Show all data sent and received
  --script-updatedb: Update the script database.
  --script-help=<Lua scripts>: Show help about scripts.
           <Lua scripts> is a comma-separated list of script-files or
           script-categories.
OS DETECTION:
  -O: Enable OS detection
  --osscan-limit: Limit OS detection to promising targets
  --osscan-guess: Guess OS more aggressively

-- Redacted for brevity --

EXAMPLES:
  nmap -v -A scanme.nmap.org
  nmap -v -sn 192.168.0.0/16 10.0.0.0/8
  nmap -v -iR 10000 -Pn -p 80
SEE THE MAN PAGE (https://nmap.org/book/man.html) FOR MORE OPTIONS AND EXAMPLES
Well, we have come to the end of this first part of network tools and utilities. Thanks so much for reading and visiting my blog! I hope you enjoyed and learned at least something new today, remember always keep learning, stay curious, and put yourself to practice everything! As with practice comes mastery.
I will see you next time for the second and following parts of this series where we will be talking about:
- Troubleshooting latency, performance, and throughput
- IPerf, NTTTCP, latte, and sockperf
- Troubleshooting DNS
- NSLookup and DIG
- Packet analysis
- Wireshark and TCPDump
- Troubleshooting the application layer (Layer 7 – HTTP/HTTPS)
- CURL and OpenSSL
- Dev-tools and Fiddler